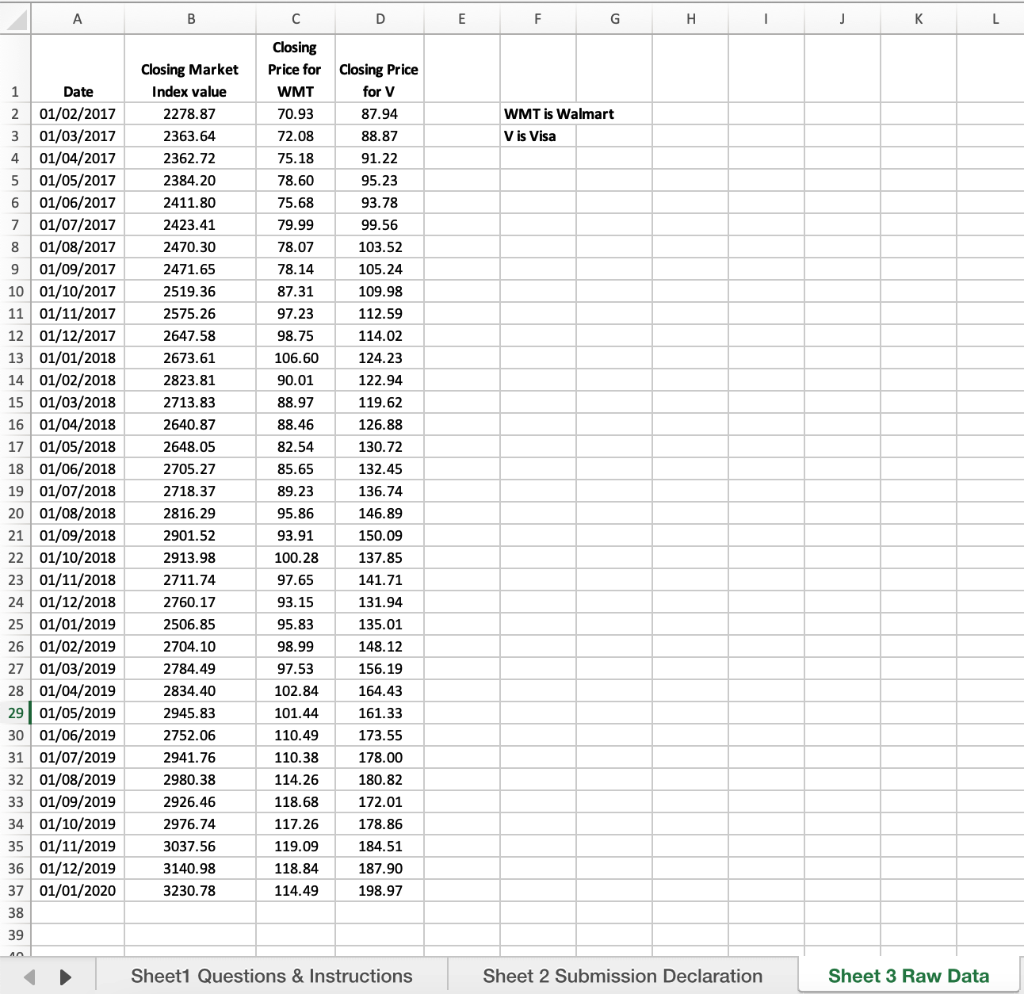
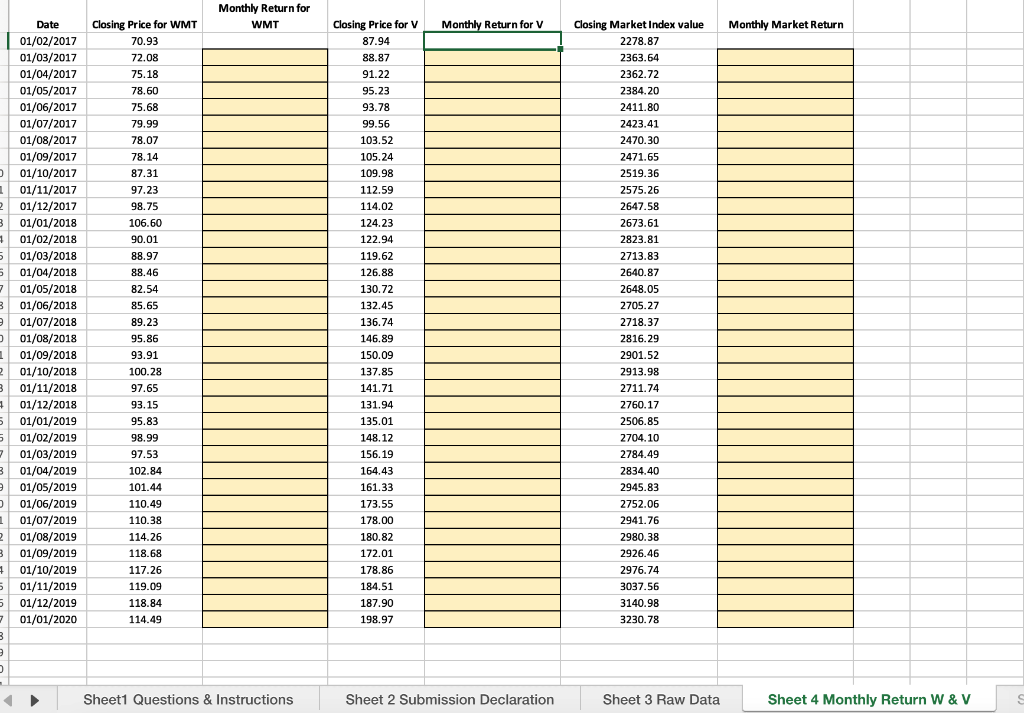
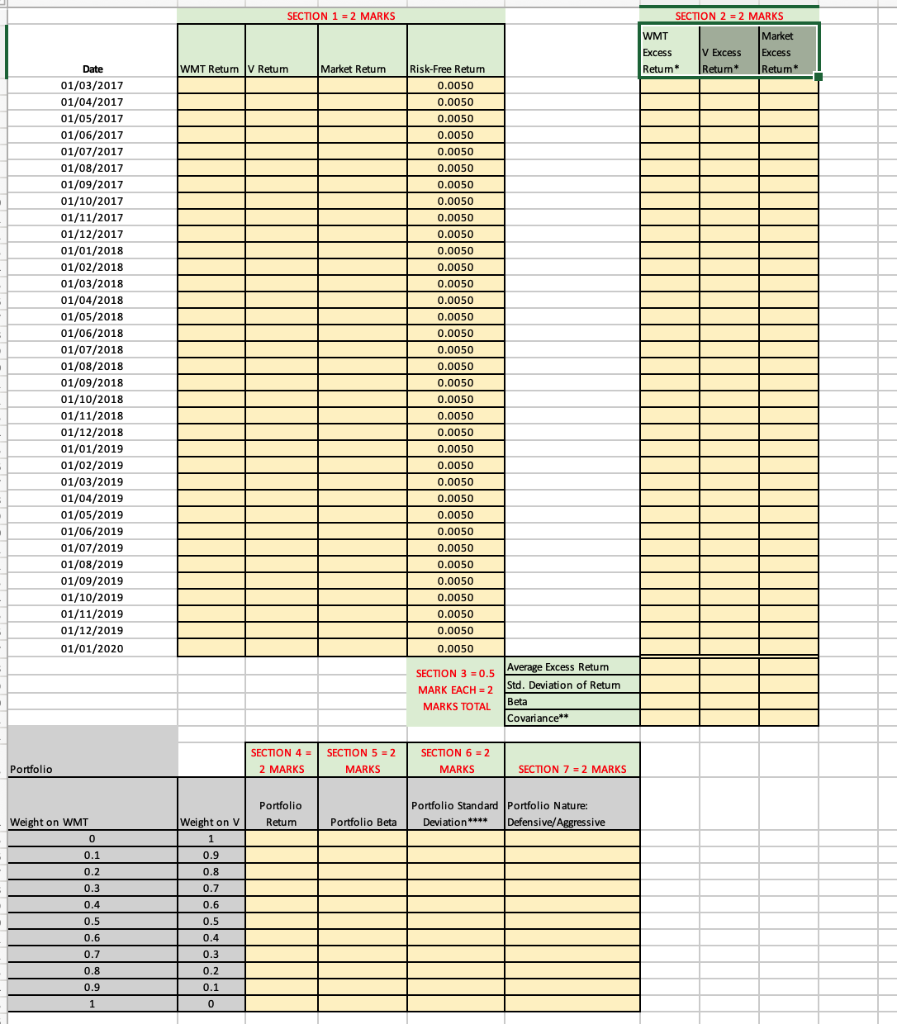
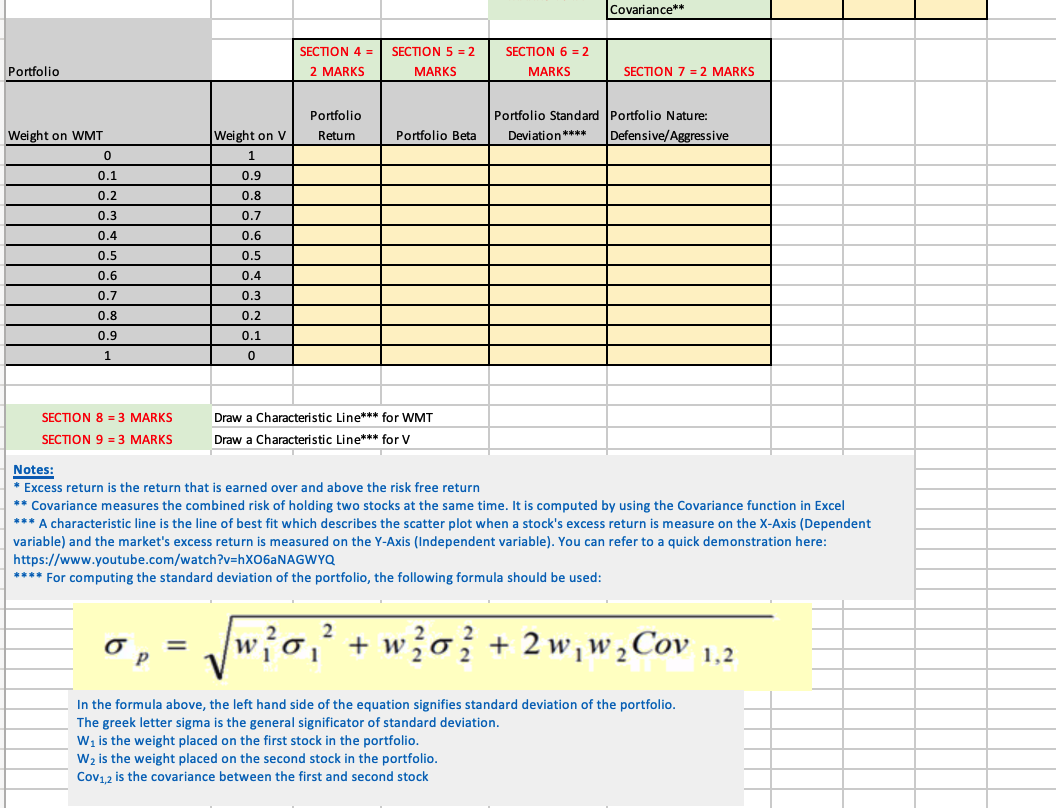
2 Use the data provided in Sheet 3 named "Raw Data" to complete the missing items in the sheets 4 and 5 named "Monthly Return Template and "Solution Template" respectively. The use of calculators and Excel functions is permitted. A B D E F G H 1 - J K L WMT is Walmart Vis Visa 1 Date 2 01/02/2017 3 01/03/2017 4 01/04/2017 5 01/05/2017 6 01/06/2017 7 01/07/2017 8 01/08/2017 9 01/09/2017 10 01/10/2017 11 01/11/2017 12 01/12/2017 13 01/01/2018 14 01/02/2018 15 01/03/2018 16 01/04/2018 17 01/05/2018 18 01/06/2018 19 01/07/2018 20 01/08/2018 21 01/09/2018 22 01/10/2018 23 01/11/2018 24 01/12/2018 25 01/01/2019 26 01/02/2019 27 01/03/2019 28 01/04/2019 29 01/05/2019 30 01/06/2019 31 01/07/2019 32 01/08/2019 33 01/09/2019 34 01/10/2019 35 01/11/2019 36 01/12/2019 37 01/01/2020 38 39 A Closing Market Index value 2278.87 2363.64 2362.72 2384.20 2411.80 2423.41 2470.30 2471.65 2519.36 2575.26 2647.58 2673.61 2823.81 2713.83 2640.87 2648.05 2705.27 2718.37 2816.29 2901.52 2913.98 2711.74 2760.17 2506.85 2704.10 2784.49 2834.40 2945.83 2752.06 2941.76 2980.38 2926.46 2976.74 3037.56 3140.98 3230.78 Closing Price for closing Price WMT for V 70.93 87.94 72.08 88.87 75.18 91.22 78.60 95.23 75.68 93.78 79.99 99.56 78.07 103.52 78.14 105.24 87.31 109.98 97.23 112.59 98.75 114.02 106.60 124.23 90.01 122.94 88.97 119.62 88.46 126.88 82.54 130.72 85.65 132.45 89.23 136.74 95.86 146.89 93.91 150.09 100.28 137.85 97.65 141.71 93.15 131.94 95.83 135.01 98.99 148.12 97.53 156.19 102.84 164.43 101.44 161.33 110.49 173.55 110.38 178.00 114.26 180.82 118.68 172.01 117.26 178.86 119.09 184.51 118.84 187.90 114.49 198.97 Sheet1 Questions & Instructions Sheet 2 Submission Declaration Sheet 3 Raw Data Monthly Return for WMT Monthly Return for v Monthly Market Return Closing Price for WMT 70.93 72.08 75.18 78.60 75.68 79.99 78.07 78.14 87.31 97.23 98.75 106.60 90.01 88.97 88.46 82.54 85.65 95 65 0020 89.23 orar 95.86 93.91 100.28 97.65 Closing Price for V 87.94 88.87 91.22 95.23 93.78 99.56 103.52 105.24 109.98 112.59 114.02 124.23 122.94 Closing Market Index value 2278.87 2363.64 2362.72 2384.20 2411.80 2423.41 2470.30 2471.65 2519.36 2575.26 . 2647.58 2673.61 2823.81 2025.01 2713.83 2640.87 2648.05 119.62 Date 01/02/2017 01/03/2017 01/04/2017 01/05/2017 01/06/2017 01/07/2017 Ver 01/08/2017 01/09/2017 U. 01/10/2017 1 01/11/2017 2 01/12/2017 3 01/01/2018 01/02/2018 01/03/2018 5 01/04/2018 7 01/05/2018 3 01/06/2018 01/07/2018 J 01/08/2018 inn 1 01/09/2018 . 2 01/10/2018 B 01/11/2018 01/12/2018 5 01/01/2019 5 01/02/2019 7 01/03/2019 3 01/04/2019 01/05/2019 logo 01/06/2019 . 01/07/2019 2 01/08/2019 3 01/09/2019 01/10/2019 5 01/11/2019 5 01/12/2019 7 01/01/2020 3 3 2705.27 93.15 95.83 98.99 97.53 102.84 101.44 110.49 40 110.38 114.26 118.68 117.26 119.09 126.88 130.72 13245 132.45 136.74 LACO 146.89 ar 150.09 137.85 141.71 131.94 135.01 148.12 156.19 164.43 161.33 173.55 178.00 180.82 172.01 178.86 184.51 187.90 198.97 374022 2016 2816.29 ma 2901.52 2913.98 2711.74 2760.17 2506.85 . 2704.10 2784.49 2834.40 2945.83 2752.06 2941.76 2980.38 2926.46 2976.74 3037.56 3140.98 3230.78 118.84 114.49 Sheet1 Questions & Instructions Sheet 2 Submission Declaration Sheet 3 Raw Data Sheet 4 Monthly Return W&V SECTION 1 = 2 MARKS SECTION 2 = 2 MARKS WMT Market Excess V Excess Excess Retum Retum Return WMT Retum IV Retum Market Return Date 01/03/2017 01/04/2017 01/05/2017 01/06/2017 01/07/2017 01/08/2017 01/09/2017 01/10/2017 01/11/2017 01/12/2017 01/01/2018 01/02/2018 01/03/2018 01/04/2018 wie 01/05/2018 01/06/2018 01/07/2018 were 01/08/2018 01/09/2018 01/10/2018 01/11/2018 01/12/2018 01/01/2019 01/02/2019 01/03/2019 01/04/2019 01/05/2019 01/06/2019 01/07/2019 01/08/2019 01/09/2019 01/10/2019 01/11/2019 01/12/2019 01/01/2020 Risk-Free Return 0.0050 0.0050 0.0050 0.0050 0.0050 0.0050 0.0050 0.0050 0.0050 0.0050 0.0050 0.0050 0.0050 0.0050 0.0050 0.0050 22 0.0050 0.0050 1934 0.0050 0.0034 0.0050 0.0050 0.0050 0.0050 0.0050 0.0050 0.0050 0.0050 SAVU 0.0050 0.0050 0.0050 0.0050 0.0050 0.0050 0.0050 0.0050 SECTION 3 =0.5 Average Excess Retum MARK EACH = 2 - 2 Std. Deviation of Retum MARKS TOTAL Beta Covariance** SECTION 4 = 2 MARKS SECTION 5 = 2 MARKS SECTION 6 = 2 = 2 MARKS Portfolio SECTION 7 = 2 MARKS -2 Portfolio Retum Portfolio Standard Portfolio Nature: Deviation **** Defensive/Aggressive Portfolio Beta Weight on V 1 0.9 Weight on WMT 0 0.1 0.2 0.3 0.4 0.5 ng 0.6 0.8 0.7 0.6 0.5 0.4 0.3 0.2 0.1 0 0.7 0.8 0.9 1 1 Covariance** SECTION 4 = 2 MARKS SECTION 5 = 2 MARKS SECTION 6 = 2 MARKS Portfolio SECTION 7 = 2 MARKS Portfolio Return Portfolio Beta Portfolio Standard Portfolio Nature: Deviation **** Defensive/Aggressive Weight on WMT 0 0.1 0.2 Weight on V 1 0.9 0.8 0.3 0.4 0.7 0.6 0.5 0.5 0.6 0.4 0.7 0.8 0.3 0.2 0.9 0.1 1 0 SECTION 8 = 3 MARKS SECTION 9 = 3 MARKS Draw a Characteristic Line*** for WMT Draw a Characteristic Line*** for V Notes: * Excess return is the return that is earned over and above the risk free return ** Covariance measures the combined risk of holding two stocks at the same time. It is computed by using the Covariance function in Excel *** A characteristic line is the line of best fit which describes the scatter plot when a stock's excess return is measure on the X-Axis (Dependent variable) and the market's excess return is measured on the Y-Axis (Independent variable). You can refer to a quick demonstration here: https://www.youtube.com/watch?v=hx06aNAGWYQ **** For computing the standard deviation of the portfolio, the following formula should be used: 2 2 9 = 2 w 0 + wo + 2 w,w2Cov 1,2 In the formula above, the left hand side of the equation signifies standard deviation of the portfolio. The greek letter sigma is the general significator of standard deviation. W, is the weight placed on the first stock in the portfolio. W2 is the weight placed on the second stock in the portfolio. COV 1,2 is the covariance between the first and second stock 2 Use the data provided in Sheet 3 named "Raw Data" to complete the missing items in the sheets 4 and 5 named "Monthly Return Template and "Solution Template" respectively. The use of calculators and Excel functions is permitted. A B D E F G H 1 - J K L WMT is Walmart Vis Visa 1 Date 2 01/02/2017 3 01/03/2017 4 01/04/2017 5 01/05/2017 6 01/06/2017 7 01/07/2017 8 01/08/2017 9 01/09/2017 10 01/10/2017 11 01/11/2017 12 01/12/2017 13 01/01/2018 14 01/02/2018 15 01/03/2018 16 01/04/2018 17 01/05/2018 18 01/06/2018 19 01/07/2018 20 01/08/2018 21 01/09/2018 22 01/10/2018 23 01/11/2018 24 01/12/2018 25 01/01/2019 26 01/02/2019 27 01/03/2019 28 01/04/2019 29 01/05/2019 30 01/06/2019 31 01/07/2019 32 01/08/2019 33 01/09/2019 34 01/10/2019 35 01/11/2019 36 01/12/2019 37 01/01/2020 38 39 A Closing Market Index value 2278.87 2363.64 2362.72 2384.20 2411.80 2423.41 2470.30 2471.65 2519.36 2575.26 2647.58 2673.61 2823.81 2713.83 2640.87 2648.05 2705.27 2718.37 2816.29 2901.52 2913.98 2711.74 2760.17 2506.85 2704.10 2784.49 2834.40 2945.83 2752.06 2941.76 2980.38 2926.46 2976.74 3037.56 3140.98 3230.78 Closing Price for closing Price WMT for V 70.93 87.94 72.08 88.87 75.18 91.22 78.60 95.23 75.68 93.78 79.99 99.56 78.07 103.52 78.14 105.24 87.31 109.98 97.23 112.59 98.75 114.02 106.60 124.23 90.01 122.94 88.97 119.62 88.46 126.88 82.54 130.72 85.65 132.45 89.23 136.74 95.86 146.89 93.91 150.09 100.28 137.85 97.65 141.71 93.15 131.94 95.83 135.01 98.99 148.12 97.53 156.19 102.84 164.43 101.44 161.33 110.49 173.55 110.38 178.00 114.26 180.82 118.68 172.01 117.26 178.86 119.09 184.51 118.84 187.90 114.49 198.97 Sheet1 Questions & Instructions Sheet 2 Submission Declaration Sheet 3 Raw Data Monthly Return for WMT Monthly Return for v Monthly Market Return Closing Price for WMT 70.93 72.08 75.18 78.60 75.68 79.99 78.07 78.14 87.31 97.23 98.75 106.60 90.01 88.97 88.46 82.54 85.65 95 65 0020 89.23 orar 95.86 93.91 100.28 97.65 Closing Price for V 87.94 88.87 91.22 95.23 93.78 99.56 103.52 105.24 109.98 112.59 114.02 124.23 122.94 Closing Market Index value 2278.87 2363.64 2362.72 2384.20 2411.80 2423.41 2470.30 2471.65 2519.36 2575.26 . 2647.58 2673.61 2823.81 2025.01 2713.83 2640.87 2648.05 119.62 Date 01/02/2017 01/03/2017 01/04/2017 01/05/2017 01/06/2017 01/07/2017 Ver 01/08/2017 01/09/2017 U. 01/10/2017 1 01/11/2017 2 01/12/2017 3 01/01/2018 01/02/2018 01/03/2018 5 01/04/2018 7 01/05/2018 3 01/06/2018 01/07/2018 J 01/08/2018 inn 1 01/09/2018 . 2 01/10/2018 B 01/11/2018 01/12/2018 5 01/01/2019 5 01/02/2019 7 01/03/2019 3 01/04/2019 01/05/2019 logo 01/06/2019 . 01/07/2019 2 01/08/2019 3 01/09/2019 01/10/2019 5 01/11/2019 5 01/12/2019 7 01/01/2020 3 3 2705.27 93.15 95.83 98.99 97.53 102.84 101.44 110.49 40 110.38 114.26 118.68 117.26 119.09 126.88 130.72 13245 132.45 136.74 LACO 146.89 ar 150.09 137.85 141.71 131.94 135.01 148.12 156.19 164.43 161.33 173.55 178.00 180.82 172.01 178.86 184.51 187.90 198.97 374022 2016 2816.29 ma 2901.52 2913.98 2711.74 2760.17 2506.85 . 2704.10 2784.49 2834.40 2945.83 2752.06 2941.76 2980.38 2926.46 2976.74 3037.56 3140.98 3230.78 118.84 114.49 Sheet1 Questions & Instructions Sheet 2 Submission Declaration Sheet 3 Raw Data Sheet 4 Monthly Return W&V SECTION 1 = 2 MARKS SECTION 2 = 2 MARKS WMT Market Excess V Excess Excess Retum Retum Return WMT Retum IV Retum Market Return Date 01/03/2017 01/04/2017 01/05/2017 01/06/2017 01/07/2017 01/08/2017 01/09/2017 01/10/2017 01/11/2017 01/12/2017 01/01/2018 01/02/2018 01/03/2018 01/04/2018 wie 01/05/2018 01/06/2018 01/07/2018 were 01/08/2018 01/09/2018 01/10/2018 01/11/2018 01/12/2018 01/01/2019 01/02/2019 01/03/2019 01/04/2019 01/05/2019 01/06/2019 01/07/2019 01/08/2019 01/09/2019 01/10/2019 01/11/2019 01/12/2019 01/01/2020 Risk-Free Return 0.0050 0.0050 0.0050 0.0050 0.0050 0.0050 0.0050 0.0050 0.0050 0.0050 0.0050 0.0050 0.0050 0.0050 0.0050 0.0050 22 0.0050 0.0050 1934 0.0050 0.0034 0.0050 0.0050 0.0050 0.0050 0.0050 0.0050 0.0050 0.0050 SAVU 0.0050 0.0050 0.0050 0.0050 0.0050 0.0050 0.0050 0.0050 SECTION 3 =0.5 Average Excess Retum MARK EACH = 2 - 2 Std. Deviation of Retum MARKS TOTAL Beta Covariance** SECTION 4 = 2 MARKS SECTION 5 = 2 MARKS SECTION 6 = 2 = 2 MARKS Portfolio SECTION 7 = 2 MARKS -2 Portfolio Retum Portfolio Standard Portfolio Nature: Deviation **** Defensive/Aggressive Portfolio Beta Weight on V 1 0.9 Weight on WMT 0 0.1 0.2 0.3 0.4 0.5 ng 0.6 0.8 0.7 0.6 0.5 0.4 0.3 0.2 0.1 0 0.7 0.8 0.9 1 1 Covariance** SECTION 4 = 2 MARKS SECTION 5 = 2 MARKS SECTION 6 = 2 MARKS Portfolio SECTION 7 = 2 MARKS Portfolio Return Portfolio Beta Portfolio Standard Portfolio Nature: Deviation **** Defensive/Aggressive Weight on WMT 0 0.1 0.2 Weight on V 1 0.9 0.8 0.3 0.4 0.7 0.6 0.5 0.5 0.6 0.4 0.7 0.8 0.3 0.2 0.9 0.1 1 0 SECTION 8 = 3 MARKS SECTION 9 = 3 MARKS Draw a Characteristic Line*** for WMT Draw a Characteristic Line*** for V Notes: * Excess return is the return that is earned over and above the risk free return ** Covariance measures the combined risk of holding two stocks at the same time. It is computed by using the Covariance function in Excel *** A characteristic line is the line of best fit which describes the scatter plot when a stock's excess return is measure on the X-Axis (Dependent variable) and the market's excess return is measured on the Y-Axis (Independent variable). You can refer to a quick demonstration here: https://www.youtube.com/watch?v=hx06aNAGWYQ **** For computing the standard deviation of the portfolio, the following formula should be used: 2 2 9 = 2 w 0 + wo + 2 w,w2Cov 1,2 In the formula above, the left hand side of the equation signifies standard deviation of the portfolio. The greek letter sigma is the general significator of standard deviation. W, is the weight placed on the first stock in the portfolio. W2 is the weight placed on the second stock in the portfolio. COV 1,2 is the covariance between the first and second stock