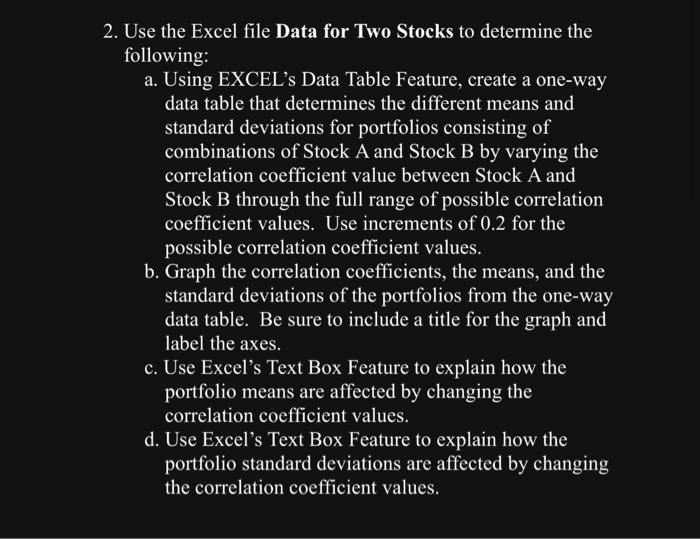
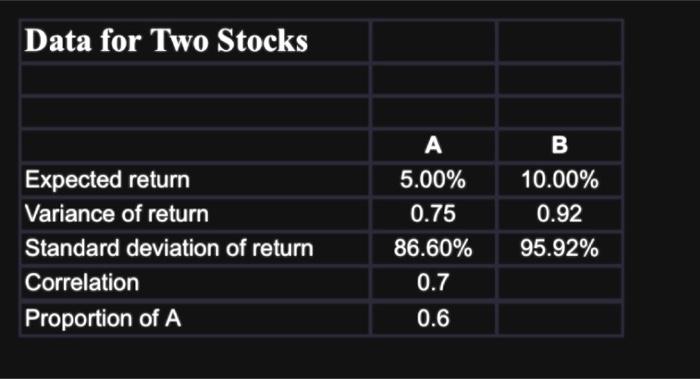
2. Use the Excel file Data for Two Stocks to determine the following: a. Using EXCEL's Data Table Feature, create a one-way data table that determines the different means and standard deviations for portfolios consisting of combinations of Stock A and Stock B by varying the correlation coefficient value between Stock A and Stock B through the full range of possible correlation coefficient values. Use increments of 0.2 for the possible correlation coefficient values. b. Graph the correlation coefficients, the means, and the standard deviations of the portfolios from the one-way data table. Be sure to include a title for the graph and label the axes. c. Use Excel's Text Box Feature to explain how the portfolio means are affected by changing the correlation coefficient values. d. Use Excel's Text Box Feature to explain how the portfolio standard deviations are affected by changing the correlation coefficient values. Data for Two Stocks \begin{tabular}{|l|c|c|} \hline & A & B \\ \hline Expected return & 5.00% & 10.00% \\ \hline Variance of return & 0.75 & 0.92 \\ \hline Standard deviation of return & 86.60% & 95.92% \\ \hline Correlation & 0.7 & \\ \hline Proportion of A & 0.6 & \\ \hline \end{tabular} 2. Use the Excel file Data for Two Stocks to determine the following: a. Using EXCEL's Data Table Feature, create a one-way data table that determines the different means and standard deviations for portfolios consisting of combinations of Stock A and Stock B by varying the correlation coefficient value between Stock A and Stock B through the full range of possible correlation coefficient values. Use increments of 0.2 for the possible correlation coefficient values. b. Graph the correlation coefficients, the means, and the standard deviations of the portfolios from the one-way data table. Be sure to include a title for the graph and label the axes. c. Use Excel's Text Box Feature to explain how the portfolio means are affected by changing the correlation coefficient values. d. Use Excel's Text Box Feature to explain how the portfolio standard deviations are affected by changing the correlation coefficient values. Data for Two Stocks \begin{tabular}{|l|c|c|} \hline & A & B \\ \hline Expected return & 5.00% & 10.00% \\ \hline Variance of return & 0.75 & 0.92 \\ \hline Standard deviation of return & 86.60% & 95.92% \\ \hline Correlation & 0.7 & \\ \hline Proportion of A & 0.6 & \\ \hline \end{tabular}