

Answered step by step
Verified Expert Solution
Question
1 Approved Answer
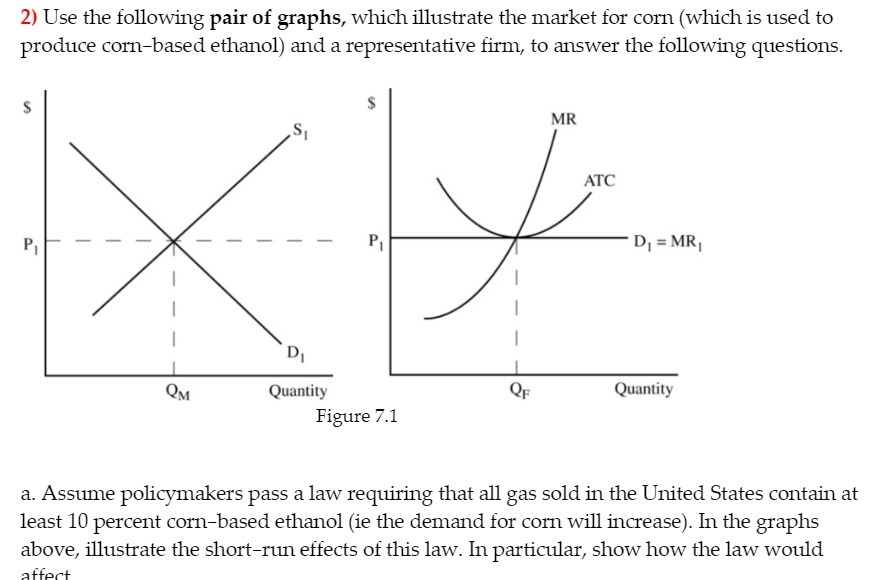
2) Use the following pair of graphs, which illustrate the market for corn (which is used to produce combased ethanol) and a representative rm, to
Step by Step Solution
There are 3 Steps involved in it
Step: 1

Get Instant Access to Expert-Tailored Solutions
See step-by-step solutions with expert insights and AI powered tools for academic success
Step: 2

Step: 3
Ace Your Homework with AI
Get the answers you need in no time with our AI-driven, step-by-step assistance
Get Started
Economics of Money, Banking and Financial Markets
Authors: Frederic S. Mishkin
9th Edition
978-0321607751, 9780321599797, 321607759, 0321599799, 978-0321598905