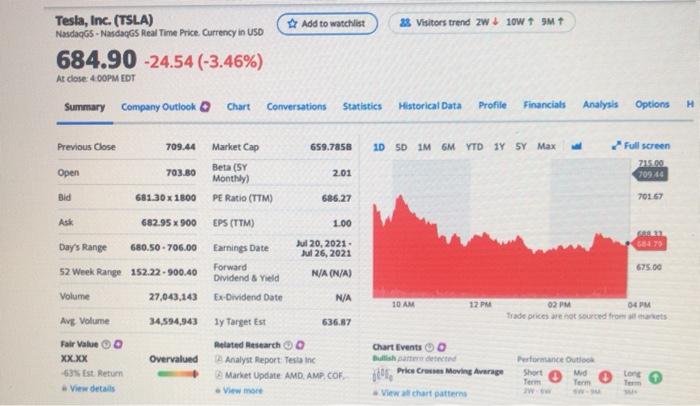
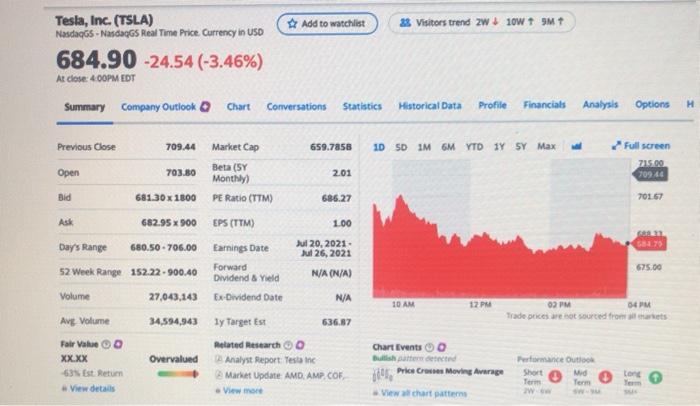
2. Use the following three methods to determine if you will purchase this stock at current market price. Assume market interest rate (r) as 12%, constant dividend growth rate (g) as 10%, and industry average P/E ratio as 35 times (1) True value method (Gordon dividend valuation model) (2) Annual rate of return method (Gordon dividend valuation model) (3) P/E multiples approach 38 Visitors trend zw 10W + 9M Tesla, Inc. (TSLA) Add to watchlist Nasdaqs - Nasdaqs Real Time Price Currency in USD 684.90 -24.54 (-3.46%) At close: 400PM EDT Summary Company Outlook Chart Conversations Statistics Historical Data Profile Financials Analysis Options H 1D SD IM 6M YTD 1Y SY Max Full screen 215.00 70940 70167 8375 Previous Close 709.44 Market Cap 659.7858 Open 703.80 Beta (SY 2.01 Monthly Bid 681.30 x 1800 PE Ratio (TTM) 686.27 682.95 x 900 EPS (TTM) 1.00 Day's Range 680.50.706.00 Earnings Date Jul 20, 2021 Jul 26, 2021 Forward 52 Week Range 152.22.900.40 Dividend & Yield N/A (N/A) Volume 27,043,143 Ex-Dividend Date NA Avg Volume 34,594,943 1y Target Est 636.87 Fair Value Related Research XX.XX Overvalued Analyst Report: Testa in 635 Est Retum Market Update AMD AMP.CO View details 675.00 10 AM 12 PM 02 PM 04 PM Trade prices are not sourced front annet Chart Events 0 Budisha e Pric Cres Moving Average Performance Outlook Short Med Term Term Long View chart patterns Currency in USD Earnings Estimate Current Our Oun 2021) Next Qtr (Sep 2021) Current Year (2021) Next Year (2022) No. of Analysts 19 19 28 27 Avg. Estimate 0.95 1.18 4.47 6.16 Low Estimate 0.62 0.82 2.96 3.96 High Estimate 1.16 1.54 5.92 8.49 Year Ago EPS 0.44 0.76 224 4.47 3. If you purchased this stock at 52 week range low, sold it at current market price, and you also received dividend during this holding period: calculate holding period rate of return 38 Visitors trend zw 10W + 9 Tesla, Inc. (TSLA) # Add to watchlist Nasdaqos - Nasdags Real Time Price Currency in USD 684.90 -24.54 (-3.46%) At close: 400PM EDT Summary Company Outlook Chart Conversations Statistics Historical Data Profile Financial Analysis Options H Previous Close 709.44 Market Cap 659.7858 1DSD IM 6M YTD 1Y SY Max Full screen 70940 70167 58475 675.00 Open 703.60 Beta (SY 2.01 Monthly Bid 68130 x 1300 PE Ratio (TTM) 686.27 Ask 682.95 x 900 EPS (TTM) 1.00 Day's Range 680.50 - 706.00 Earnings Date Jul 20, 2021 Jul 26, 2021 Forward 52 Week Range 152.22.900.40 Dividend & Yield N/A (N/A) Volume 27,043,143 EvDividend Date Avg Volume 34,594,943 1y Target est 636.87 Fair Value Related Research XX.XX Overvalued Analyst Report. Testa in 635 Est Return Market Update AMD AMP.COK View details NA 10 AM 12 PM 02 PM 04 PM Trade prices are cont sourced from all arets Chart Events 0 0 Bushattered Der Price Cross Moving Average Performance Out Short Med Term Tere View chart patterns Currency in USD Earnings Estimate Current Our Oun 2021) Next Qtr (Sep 2021) Current Year (2021) Next Year (2022) No. of Analysts 19 19 28 27 Avg. Estimate 0.95 1.18 4.47 6.16 Low Estimate 0.62 0.82 2.96 3.96 High Estimate 1.16 1.54 5.92 8.49 Year Ago EPS 0.44 0.76 224 4.47 2. Use the following three methods to determine if you will purchase this stock at current market price. Assume market interest rate (r) as 12%, constant dividend growth rate (g) as 10%, and industry average P/E ratio as 35 times (1) True value method (Gordon dividend valuation model) (2) Annual rate of return method (Gordon dividend valuation model) (3) P/E multiples approach 38 Visitors trend zw 10W + 9M Tesla, Inc. (TSLA) Add to watchlist Nasdaqs - Nasdaqs Real Time Price Currency in USD 684.90 -24.54 (-3.46%) At close: 400PM EDT Summary Company Outlook Chart Conversations Statistics Historical Data Profile Financials Analysis Options H 1D SD IM 6M YTD 1Y SY Max Full screen 215.00 70940 70167 8375 Previous Close 709.44 Market Cap 659.7858 Open 703.80 Beta (SY 2.01 Monthly Bid 681.30 x 1800 PE Ratio (TTM) 686.27 682.95 x 900 EPS (TTM) 1.00 Day's Range 680.50.706.00 Earnings Date Jul 20, 2021 Jul 26, 2021 Forward 52 Week Range 152.22.900.40 Dividend & Yield N/A (N/A) Volume 27,043,143 Ex-Dividend Date NA Avg Volume 34,594,943 1y Target Est 636.87 Fair Value Related Research XX.XX Overvalued Analyst Report: Testa in 635 Est Retum Market Update AMD AMP.CO View details 675.00 10 AM 12 PM 02 PM 04 PM Trade prices are not sourced front annet Chart Events 0 Budisha e Pric Cres Moving Average Performance Outlook Short Med Term Term Long View chart patterns Currency in USD Earnings Estimate Current Our Oun 2021) Next Qtr (Sep 2021) Current Year (2021) Next Year (2022) No. of Analysts 19 19 28 27 Avg. Estimate 0.95 1.18 4.47 6.16 Low Estimate 0.62 0.82 2.96 3.96 High Estimate 1.16 1.54 5.92 8.49 Year Ago EPS 0.44 0.76 224 4.47 3. If you purchased this stock at 52 week range low, sold it at current market price, and you also received dividend during this holding period: calculate holding period rate of return 38 Visitors trend zw 10W + 9 Tesla, Inc. (TSLA) # Add to watchlist Nasdaqos - Nasdags Real Time Price Currency in USD 684.90 -24.54 (-3.46%) At close: 400PM EDT Summary Company Outlook Chart Conversations Statistics Historical Data Profile Financial Analysis Options H Previous Close 709.44 Market Cap 659.7858 1DSD IM 6M YTD 1Y SY Max Full screen 70940 70167 58475 675.00 Open 703.60 Beta (SY 2.01 Monthly Bid 68130 x 1300 PE Ratio (TTM) 686.27 Ask 682.95 x 900 EPS (TTM) 1.00 Day's Range 680.50 - 706.00 Earnings Date Jul 20, 2021 Jul 26, 2021 Forward 52 Week Range 152.22.900.40 Dividend & Yield N/A (N/A) Volume 27,043,143 EvDividend Date Avg Volume 34,594,943 1y Target est 636.87 Fair Value Related Research XX.XX Overvalued Analyst Report. Testa in 635 Est Return Market Update AMD AMP.COK View details NA 10 AM 12 PM 02 PM 04 PM Trade prices are cont sourced from all arets Chart Events 0 0 Bushattered Der Price Cross Moving Average Performance Out Short Med Term Tere View chart patterns Currency in USD Earnings Estimate Current Our Oun 2021) Next Qtr (Sep 2021) Current Year (2021) Next Year (2022) No. of Analysts 19 19 28 27 Avg. Estimate 0.95 1.18 4.47 6.16 Low Estimate 0.62 0.82 2.96 3.96 High Estimate 1.16 1.54 5.92 8.49 Year Ago EPS 0.44 0.76 224 4.47


