Answered step by step
Verified Expert Solution
Link Copied!

Question

1 Approved Answer

2. Use the Verlet method to calculate the period T(0m) of a simple pendulum as a function of the initial angle Om. Do this for
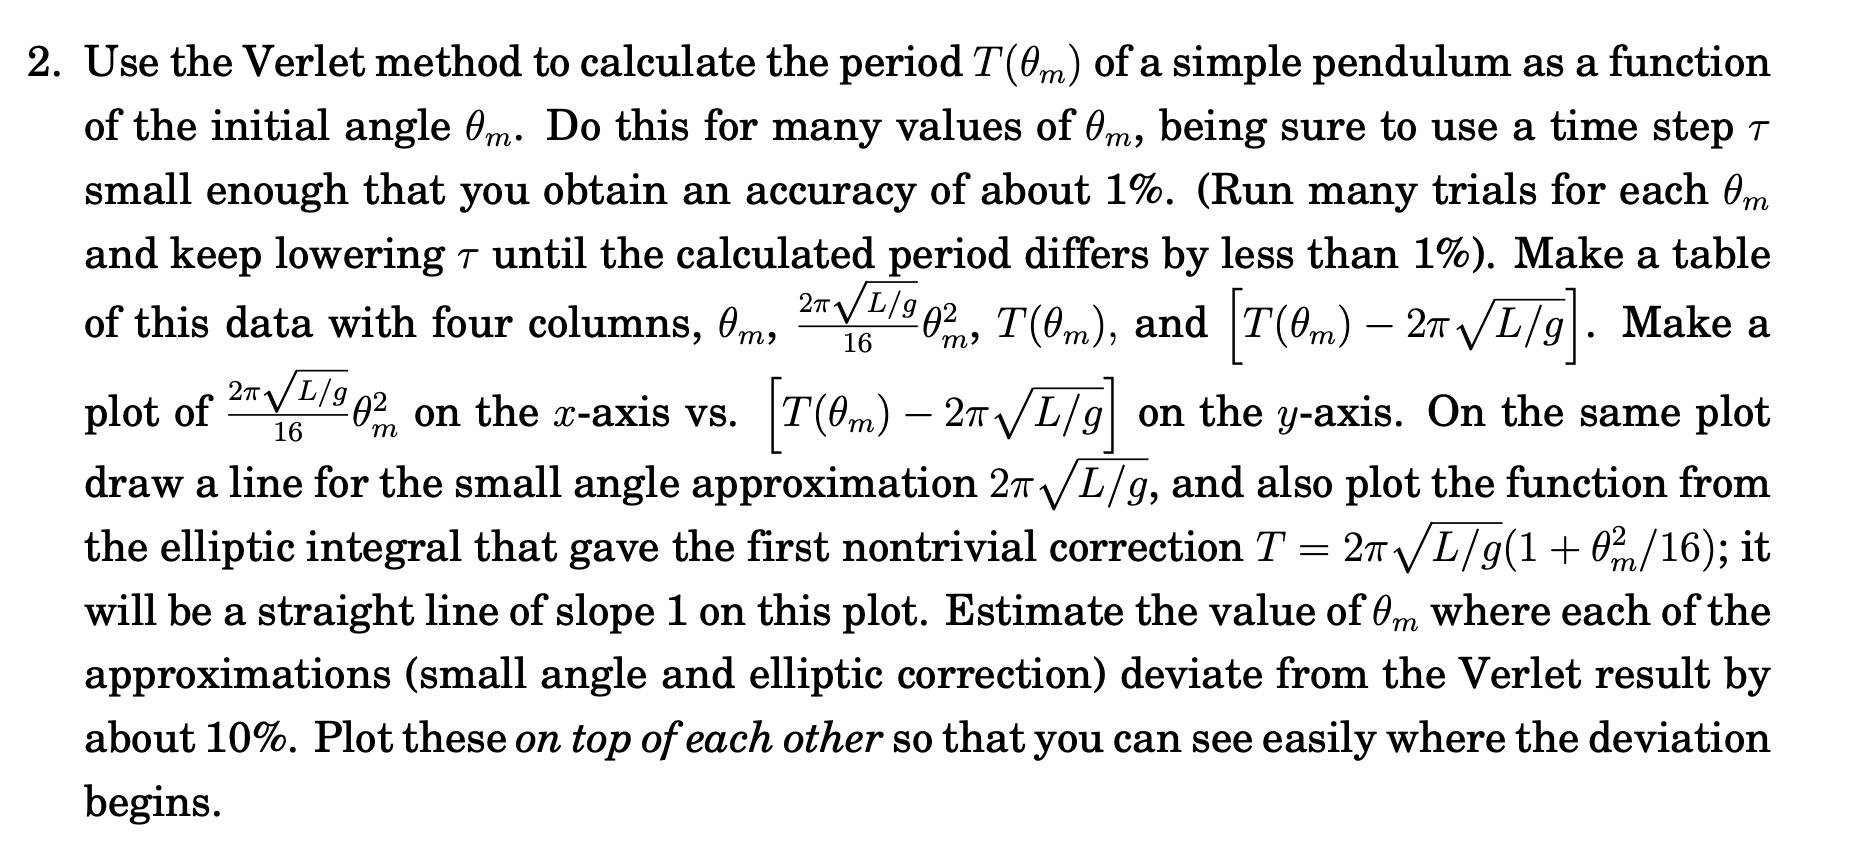
image text in transcribed

2. Use the Verlet method to calculate the period T(0m) of a simple pendulum as a function of the initial angle Om. Do this for many values of Om, being sure to use a time step t small enough that you obtain an accuracy of about 1%. (Run many trials for each Om and keep lowering T until the calculated period differs by less than 1%). Make a table of this data with four columns, Om, 20 VF/4.05, T(m), and (T(0m) 20 VE 19 %, T(@m), and (T(0m) 27 VL/9]. Make a plot of 240 V/902 on the t-axis vs. (T(Om) 21 VL/g) on the y-axis. On the same plot draw a line for the small angle approximation 2 L/g, and also plot the function from the elliptic integral that gave the first nontrivial correction T = 27 VL/g(1 + 02/16); it will be a straight line of slope 1 on this plot. Estimate the value of Om where each of the approximations (small angle and elliptic correction) deviate from the Verlet result by about 10%. Plot these on top of each other so that you can see easily where the deviation begins. 2. Use the Verlet method to calculate the period T(0m) of a simple pendulum as a function of the initial angle Om. Do this for many values of Om, being sure to use a time step t small enough that you obtain an accuracy of about 1%. (Run many trials for each Om and keep lowering T until the calculated period differs by less than 1%). Make a table of this data with four columns, Om, 20 VF/4.05, T(m), and (T(0m) 20 VE 19 %, T(@m), and (T(0m) 27 VL/9]. Make a plot of 240 V/902 on the t-axis vs. (T(Om) 21 VL/g) on the y-axis. On the same plot draw a line for the small angle approximation 2 L/g, and also plot the function from the elliptic integral that gave the first nontrivial correction T = 27 VL/g(1 + 02/16); it will be a straight line of slope 1 on this plot. Estimate the value of Om where each of the approximations (small angle and elliptic correction) deviate from the Verlet result by about 10%. Plot these on top of each other so that you can see easily where the deviation begins

Step by Step Solution

There are 3 Steps involved in it

Step: 1

blur-text-image

Get Instant Access to Expert-Tailored Solutions

See step-by-step solutions with expert insights and AI powered tools for academic success

Step: 2

blur-text-image

Step: 3

blur-text-image

Ace Your Homework with AI

Get the answers you need in no time with our AI-driven, step-by-step assistance

Get Started

Recommended Textbook for

Database Design Application Development And Administration

Authors: Mannino Michael

5th Edition

0983332401, 978-0983332404

More Books

Students also viewed these Databases questions

Question

How can an analyst determine when a user interface is required?

Answered: 1 week ago

Question

What does Processing of an OLAP Cube accomplish?

Answered: 1 week ago