Answered step by step
Verified Expert Solution
Link Copied!

Question

1 Approved Answer

2. Using a straight edge ,draw a line that best fits the data plotted on the above graph .Note : Only draw one line
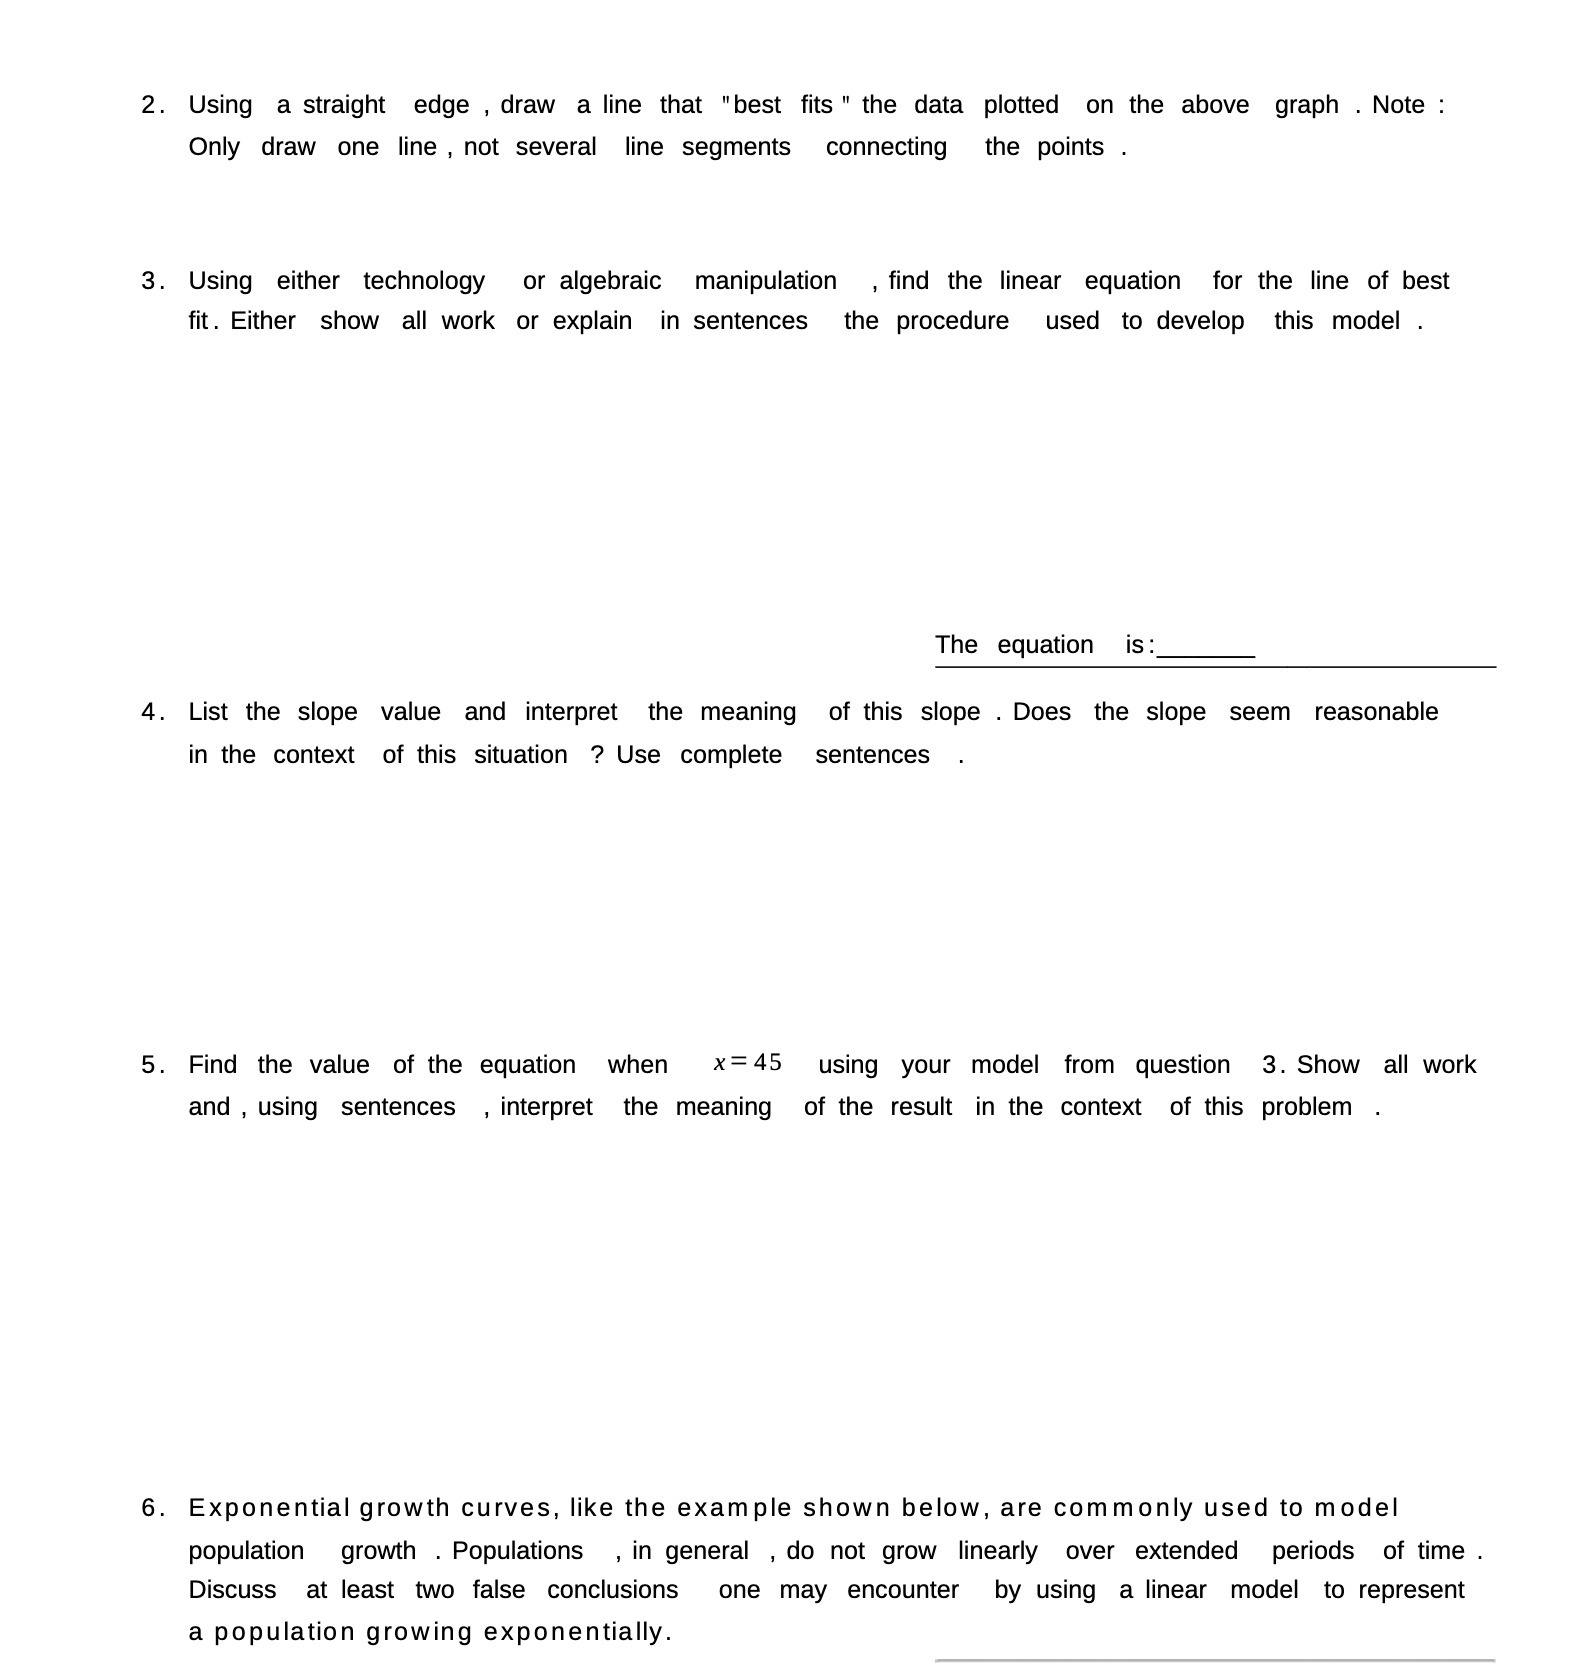
image text in transcribed
2. Using a straight edge ,draw a line that "best fits " the data plotted on the above graph .Note : Only draw one line , not several line segments connecting the points . 3. Using either technology or algebraic manipulation .find the linear equation for the line of best fit. Either show all work or explain in sentences the procedure used to develop this model . The equation is: 4. List the slope value and interpret the meaning of this slope .Does the slope seem reasonable in the context of this situation ? Use complete sentences 5. Find the value of the equation when x=45 using your model from question 3.Show all work and , using sentences ,interpret the meaning of the result in the context of this problem 6. Exponential growth curves, like the example shown below, are commonly used to model population growth .Populations ,in general ,do not grow linearly over extended periods of time. Discuss at least two false conclusions one may encounter by using a linear model to represent a population growing exponentially

Step by Step Solution

There are 3 Steps involved in it

Step: 1

blur-text-image

Get Instant Access to Expert-Tailored Solutions

See step-by-step solutions with expert insights and AI powered tools for academic success

Step: 2

blur-text-image

Step: 3

blur-text-image

Ace Your Homework with AI

Get the answers you need in no time with our AI-driven, step-by-step assistance

Get Started

Recommended Textbook for

Calculus Early Transcendentals

Authors: James Stewart

7th edition

538497904, 978-0538497909

More Books

Students also viewed these Mathematics questions