

Answered step by step
Verified Expert Solution
Question
1 Approved Answer
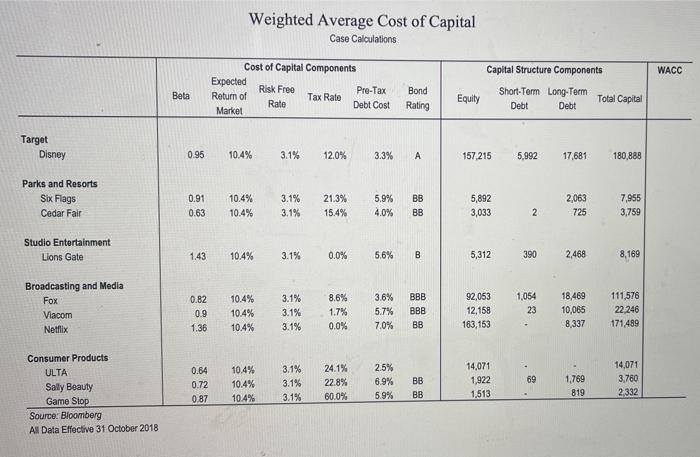
2. Using the accompanying spreadsheet, calculate the WACC for each Disney segment comparable. Describe the prima- ry WACC drivers that explain the differences between the
Step by Step Solution
There are 3 Steps involved in it
Step: 1

Get Instant Access to Expert-Tailored Solutions
See step-by-step solutions with expert insights and AI powered tools for academic success
Step: 2

Step: 3
Ace Your Homework with AI
Get the answers you need in no time with our AI-driven, step-by-step assistance
Get Started
Private Equity Value Creation Analysis Volume I
Authors: Michael David Reinard
1st Edition
1736077821, 978-1736077825