Answered step by step
Verified Expert Solution
Link Copied!

Question

1 Approved Answer

2. We all know that fruit is good for us. Many of us don't eat enough. The figure below is a histogram of the number
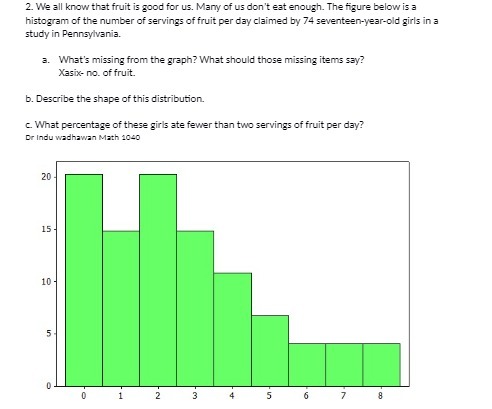
image text in transcribed
2. We all know that fruit is good for us. Many of us don't eat enough. The figure below is a histogram of the number of servings of fruit per day claimed by 74 seventeen-year-old girls in a study in Pennsylvania. 3. What's missing from the graph? What should those missing items say? Xasix- no. of fruit. b. Describe the shape of this distribution. c. What percentage of these girls ate fewer than two servings of fruit per day? Or Indu wadhawan Math 1040 20 15 - 10 - 5 US . 4 5 6 7

Step by Step Solution

There are 3 Steps involved in it

Step: 1

blur-text-image

Get Instant Access to Expert-Tailored Solutions

See step-by-step solutions with expert insights and AI powered tools for academic success

Step: 2

blur-text-image_2

Step: 3

blur-text-image_3

Ace Your Homework with AI

Get the answers you need in no time with our AI-driven, step-by-step assistance

Get Started

Recommended Textbook for

Essential University Physics

Authors: Richard Wolfson

2nd Edition

0321706692, 978-0321706690

More Books

Students also viewed these Mathematics questions