Question
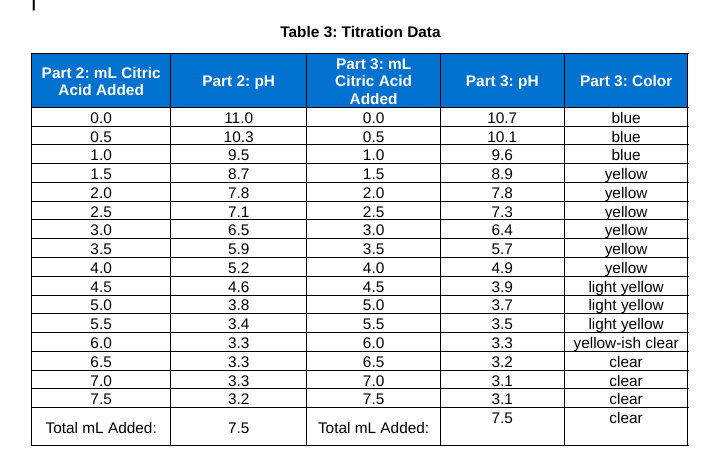
2. What is the pH of the solution at the equivalence point shown by the titration curve? 3. Which indicator shows a color change at

2. What is the pH of the solution at the equivalence point shown by the titration curve?
3. Which indicator shows a color change at about the same pH as the equivalence point?
4. Fill in the following data:
a. The initial color of the solution:
b. Amount of citric acid needed to reach the end point:
c. Color of solution after endpoint was reached:
5. Identify two reasons why you did not choose the other two indicators to be used in the titration? titration.
6. How did the mL of titrant needed to reach the endpoint using the indicator you chose compare with the mL of titrant needed to reach the equivalence point?
7. Is the indicator you chose a good indicator for this titration? Explain your answer.
Table 3: Titration DataStep by Step Solution
There are 3 Steps involved in it
Step: 1

Get Instant Access to Expert-Tailored Solutions
See step-by-step solutions with expert insights and AI powered tools for academic success
Step: 2

Step: 3

Ace Your Homework with AI
Get the answers you need in no time with our AI-driven, step-by-step assistance
Get Started


