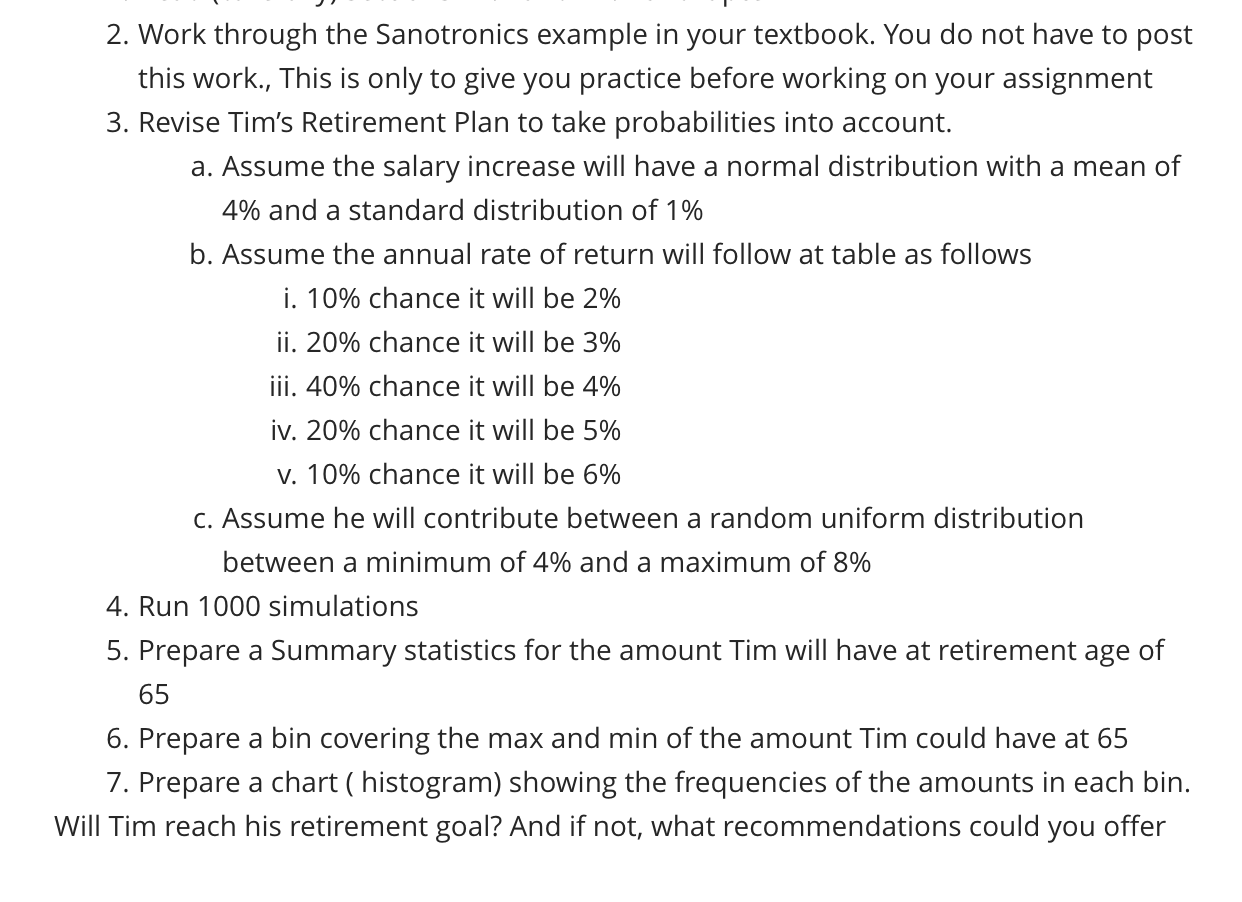
2. Work through the Sanotronics example in your textbook. You do not have to post this work., This is only to give you practice before working on your assignment 3. Revise Tim's Retirement Plan to take probabilities into account. a. Assume the salary increase will have a normal distribution with a mean of 4% and a standard distribution of 1% b. Assume the annual rate of return will follow at table as follows i. 10% chance it will be 2% ii. 20% chance it will be 3% iii. 40% chance it will be 4% iv. 20% chance it will be 5% v. 10% chance it will be 6% C. Assume he will contribute between a random uniform distribution between a minimum of 4% and a maximum of 8% 4. Run 1000 simulations 5. Prepare a Summary statistics for the amount Tim will have at retirement age of 65 6. Prepare a bin covering the max and min of the amount Tim could have at 65 7. Prepare a chart (histogram) showing the frequencies of the amounts in each bin. Will Tim reach his retirement goal? And if not, what recommendations could you offer 2. Work through the Sanotronics example in your textbook. You do not have to post this work., This is only to give you practice before working on your assignment 3. Revise Tim's Retirement Plan to take probabilities into account. a. Assume the salary increase will have a normal distribution with a mean of 4% and a standard distribution of 1% b. Assume the annual rate of return will follow at table as follows i. 10% chance it will be 2% ii. 20% chance it will be 3% iii. 40% chance it will be 4% iv. 20% chance it will be 5% v. 10% chance it will be 6% C. Assume he will contribute between a random uniform distribution between a minimum of 4% and a maximum of 8% 4. Run 1000 simulations 5. Prepare a Summary statistics for the amount Tim will have at retirement age of 65 6. Prepare a bin covering the max and min of the amount Tim could have at 65 7. Prepare a chart (histogram) showing the frequencies of the amounts in each bin. Will Tim reach his retirement goal? And if not, what recommendations could you offer


