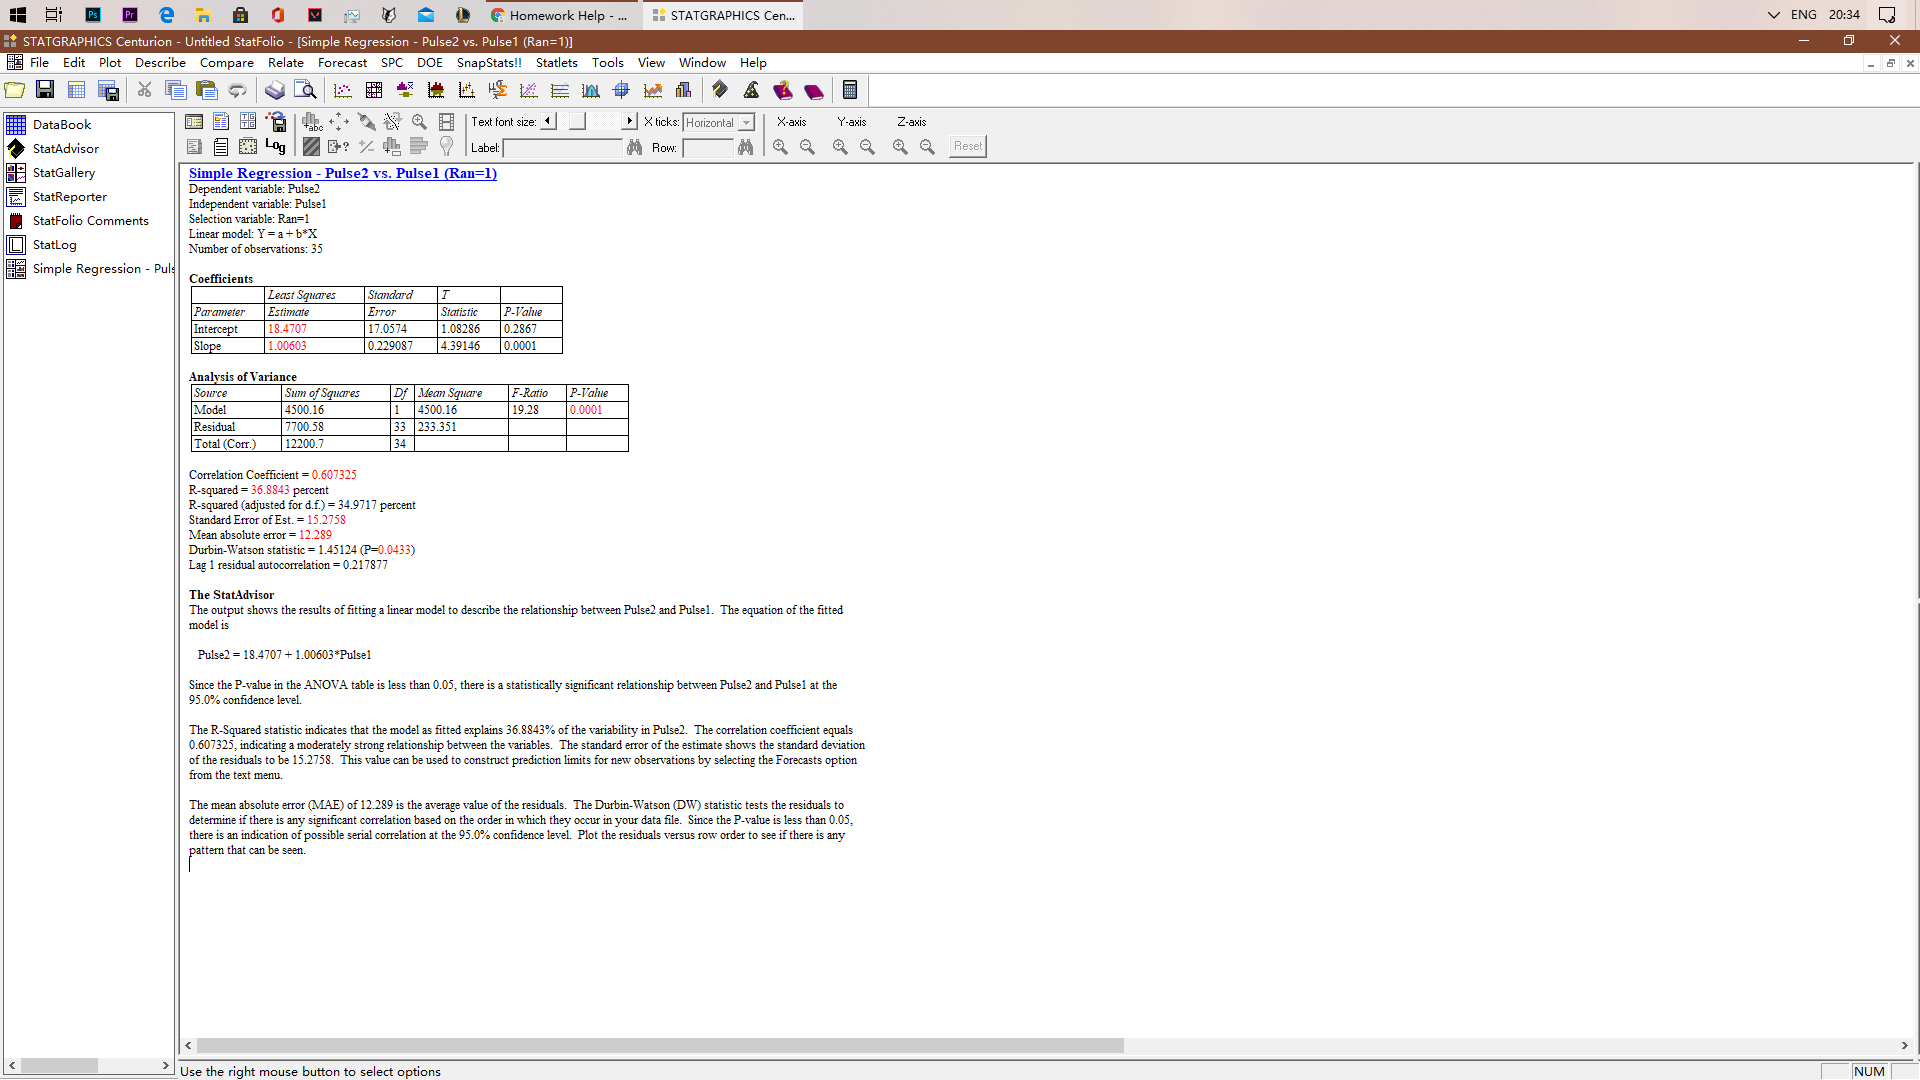
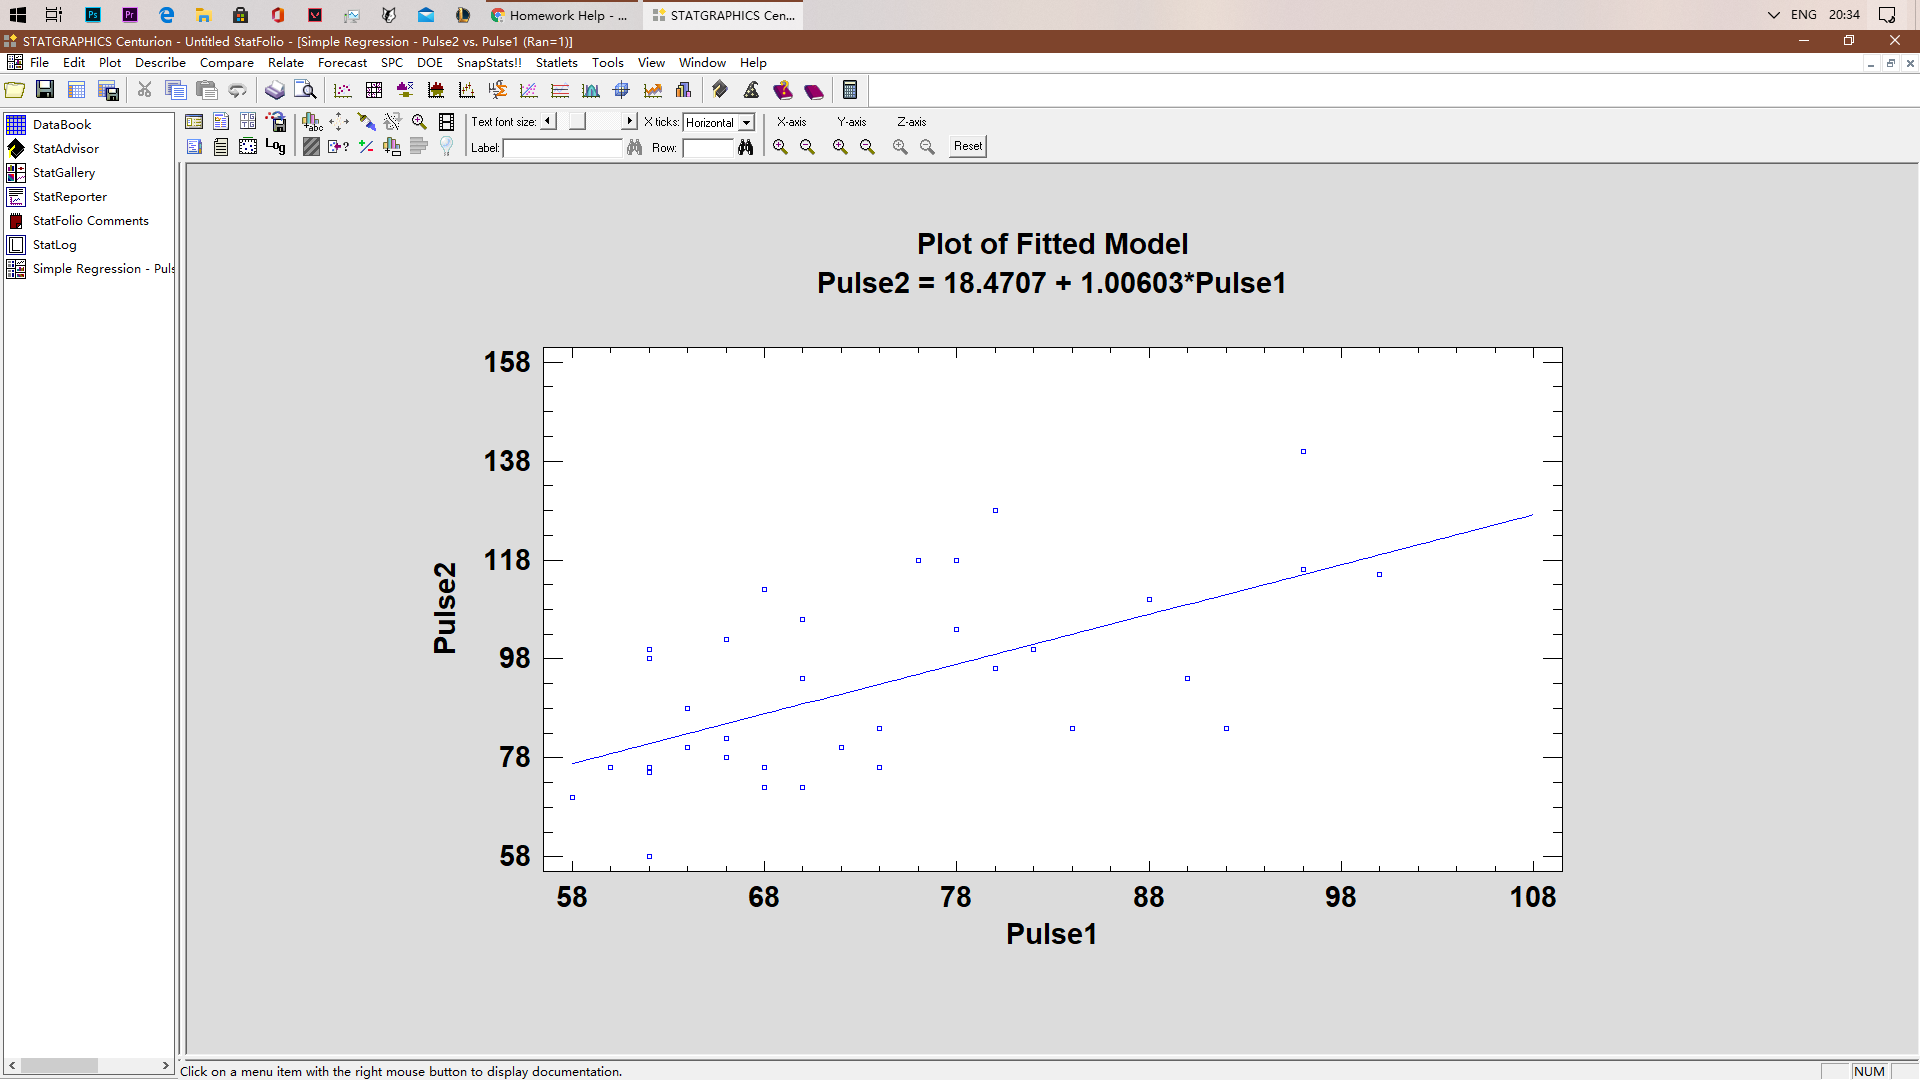
2. Write down the regression (least square) line. [1 mark]
3. Can we conclude that Pulse1 and Pulse2 are correlated? Show your work. [4 marks]
4. If a student's resting pulse rate (Pulse1) is 70 beats per minute, use the regression line to predict his/ her pulse rate (Pulse2) after running in place for a minute. Use an interval estimate that will be correct about 95% of the time. (Here, we are assuming all regression assumptions are satisfied). [3 marks]
5. Explain why we should not use the above regression equation to predict the second pulse reading of a student whose first pulse reading is 50 beats per minute. [2 marks]
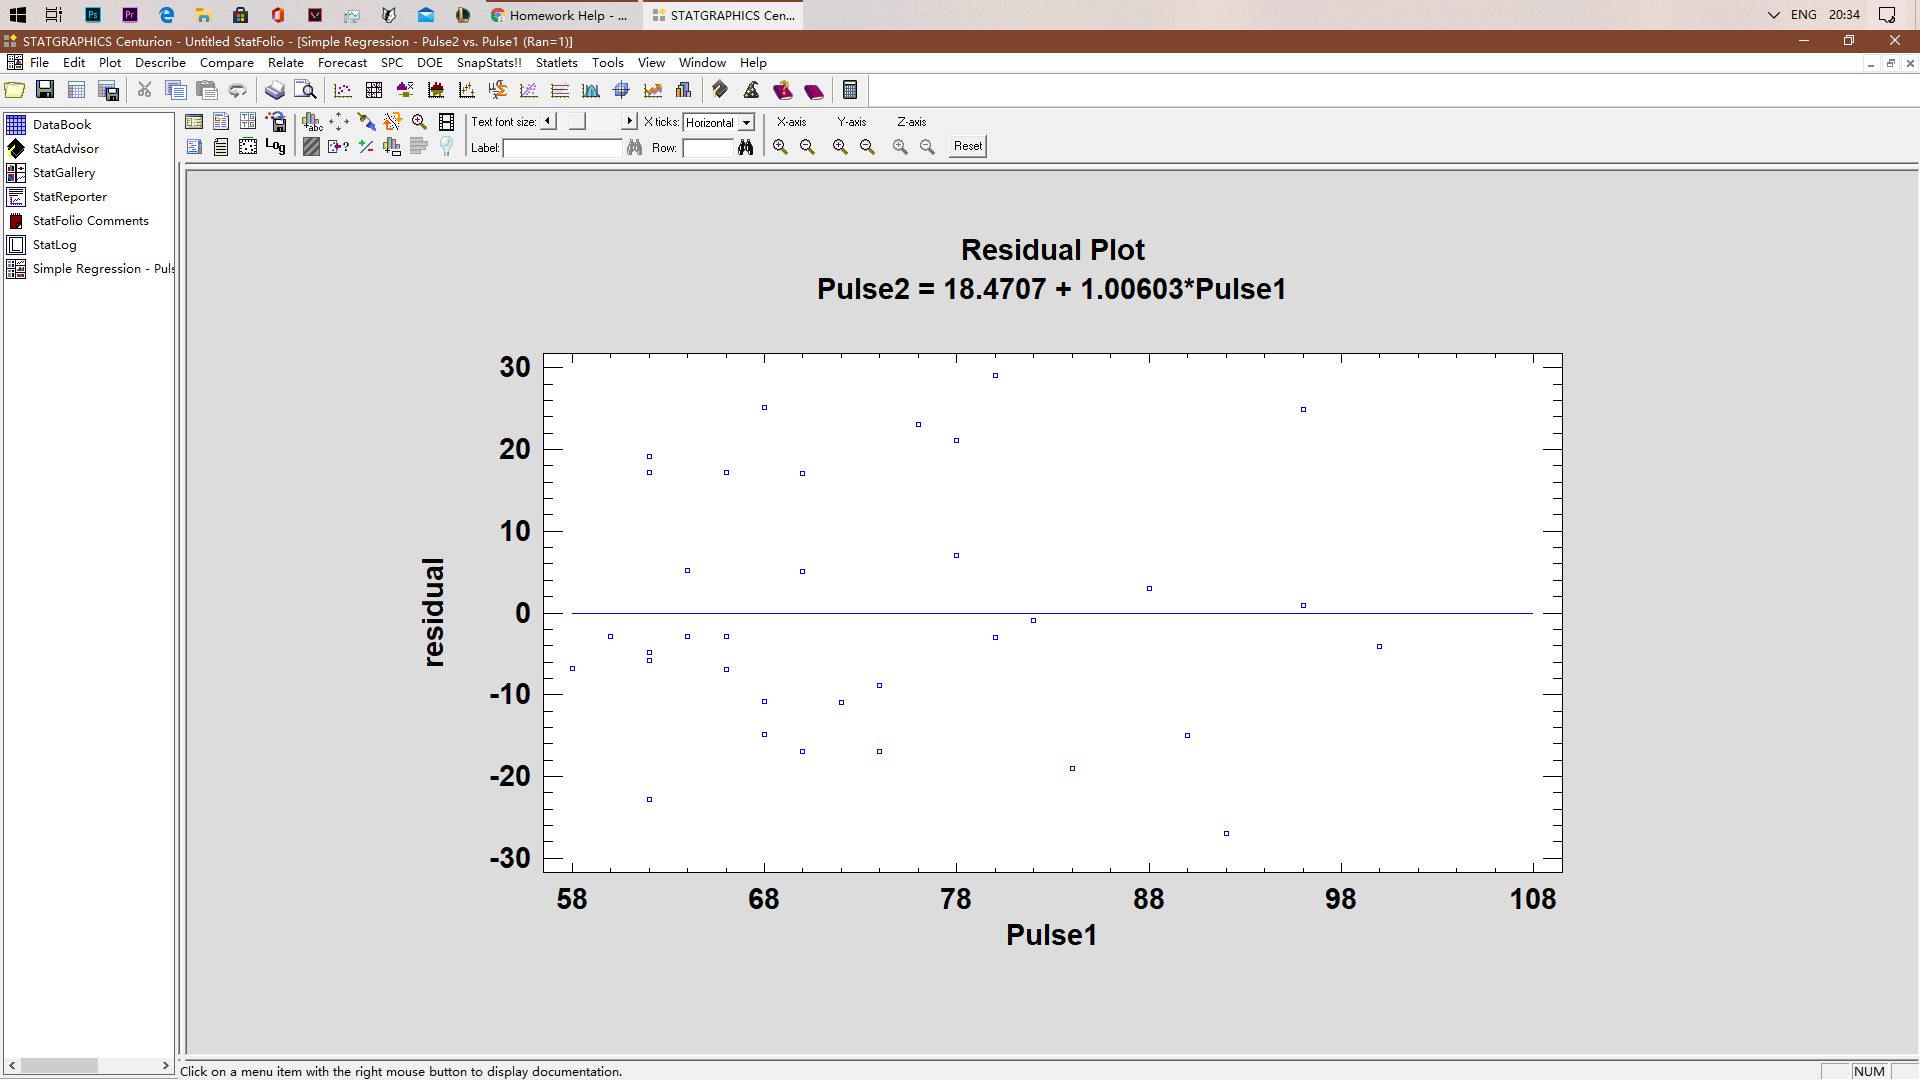
6. Examine the Residual Plot. Does it give any serious indication that the linearity
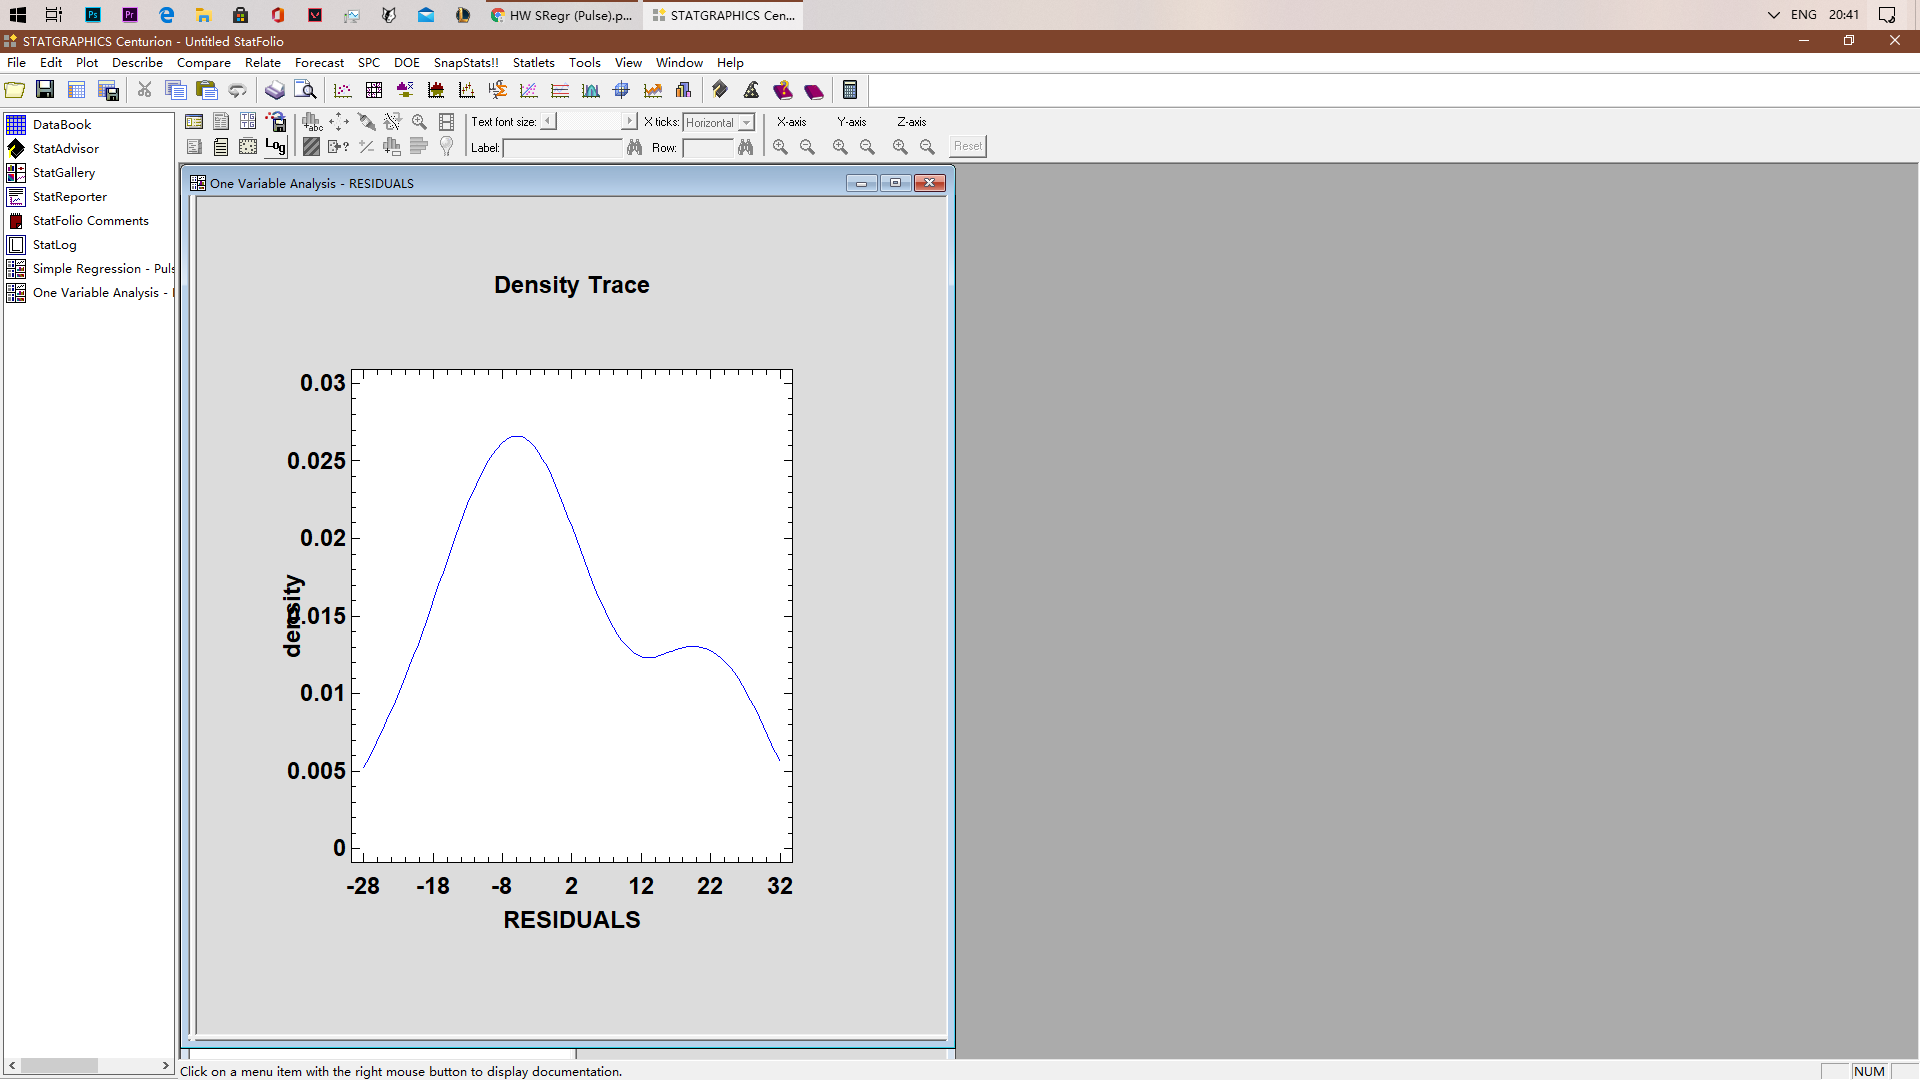
8. Explain what the Normality Assumption means in this problem, and assess whether it is reasonable. [4 marks]
Hi s P ehBONYAL Homework Help -. STATGRAPHICS Cen. V ENG 20:34 3 STATGRAPHICS Centurion - Untitled StatFolio - [Simple Regression - Pulse2 vs. Pulse1 (Ran=1)] X File Edit Plot Describe Compare Relate Forecast SPC DOE SnapStats! Statlets Tools View Window Help - 5 X DataBook : 6 6 8 |Text font size: X ticks: Horizontal |X-axis Y-axis Z-axis StatAdvisor Label Row: Q Q Q 9 4 8 Reset StatGallery Simple Regression - Pulse2 vs. Pulsel (Ran=1) StatReporter Dependent variable: Pulse2 Independent variable: Pulsel StatFolio Comments Selection variable: Ran=1 StatLog Linear model: Y = a + b*X Number of observations: 35 Simple Regression - Puls Coefficients Least Squares Standard Parameter Estimate Error Statistic P-Value Intercept 18.470 17.0574 1.08286 0.286 Slope 1.00603 0.229087 4.39146 0.0001 Analysis of Variance Source Sum of Squares Df Mean Square F-Ratio P-Value Model 4500.16 4500.1 19 28 0.0001 Residual 700.58 33 233.351 Total (Corr.) 12200.7 34 Correlation Coefficient = 0.607325 R-squared = 36.8843 percent R-squared (adjusted for d.f.) = 34.9717 percent Standard Error of Est. = 15.2758 Mean absolute error = 12.289 Durbin-Watson statistic = 1.45124 (P=0.0433) Lag 1 residual autocorrelation = 0.217877 The StatAdvisor The output shows the results of fitting a linear model to describe the relationship between Pulse2 and Pulsel. The equation of the fitted model is Pulse2 = 18.4707 + 1.00603*Pulse1 Since the P-value in the ANOVA table is less than 0.05, there is a statistically significant relationship between Pulse2 and Pulsel at the 95.0% confidence level. The R-Squared statistic indicates that the model as fitted explains 36.8843% of the variability in Pulse2. The correlation coefficient equals 0.607325, indicating a moderately strong relationship between the variables. The standard error of the estimate shows the standard deviation of the residuals to be 15.2758. This value can be used to construct prediction limits for new observations by selecting the Forecasts option from the text menu. The mean absolute error (MAE) of 12.289 is the average value of the residuals. The Durbin-Watson (DW) statistic tests the residuals to determine if there is any significant correlation based on the order in which they occur in your data file. Since the P-value is less than 0.05, there is an indication of possible serial correlation at the 95.0% confidence level. Plot the residuals versus row order to see if there is any pattern that can be seen. Use the right mouse button to NUMif P P e haONyet Homework Help -. STATGRAPHICS Cen. V ENG 20:34 3 STATGRAPHICS Centurion - Untitled StatFolio - [Simple Regression - Pulse2 vs. Pulse1 (Ran=1)] X File Edit Plot Describe Compare Relate Forecast SPC DOE SnapStats! Statlets s Tools View Window Help - 5 X DataBook 3 : 4 8 8 Text font size: X ticks: Horizontal |X-axis Y-axis Z-axis StatAdvisor 3 04|7 0 % |Label: Row: M Q Q Q Q 4 8 Reset StatGallery StatReporter StatFolio Comments StatLog Plot of Fitted Model Simple Regression - Puls Pulse2 = 18.4707 + 1.00603*Pulse1 158 138 Pulse2 118 98 78 58 58 68 78 88 98 108 Pulse1 Click on a menu it with the r button to display NUMif P P e haONyet Homework Help -. STATGRAPHICS Cen. V ENG 20:34 3 STATGRAPHICS Centurion - Untitled StatFolio - [Simple Regression - Pulse2 vs. Pulse1 (Ran=1)] X File Edit Plot Describe Compare Relate Forecast SPC DOE SnapStats! Statlets s Tools View Window Help - 5 X DataBook 3 : 4 8 8 Text font size: X ticks: Horizontal |X-axis Y-axis Z-axis StatAdvisor 3 04|7 0 % |Label: Row: M Q Q Q Q 4 8 Reset StatGallery StatReporter StatFolio Comments StatLog Plot of Fitted Model Simple Regression - Puls Pulse2 = 18.4707 + 1.00603*Pulse1 158 138 Pulse2 118 98 78 58 58 68 78 88 98 108 Pulse1 Click on a menu it with the r button to display NUMHi s Pe MAONyet Homework Help -. STATGRAPHICS Cen. V ENG 20:34 3 STATGRAPHICS Centurion - Untitled StatFolio - [Simple Regression - Pulse2 vs. Pulse1 (Ran=1)] File Edit Plot Describe Compare Relate Forecast SPC DOE SnapStats! Statlets X s Tools View Window Help - 5 X DataBook Text font size: X ticks: Horizontal |X-axis Y-axis Z-axis StatAdvisor 3 04 7 0 % 42 7 |Label: Row: MQ Q Q Q 4 0 Reset StatGallery StatReporter StatFolio Comments StatLog Simple Regression - Puls Residual Plot Pulse2 = 18.4707 + 1.00603*Pulse1 30 20 C 10 residual 0 -10 D -20 -30 58 68 78 88 98 108 Pulse1 Click on a menu it with the r button to display NUMHi s Pe MAONyet Homework Help -. STATGRAPHICS Cen. V ENG 20:34 3 STATGRAPHICS Centurion - Untitled StatFolio - [Simple Regression - Pulse2 vs. Pulse1 (Ran=1)] File Edit Plot Describe Compare Relate Forecast SPC DOE SnapStats! Statlets X s Tools View Window Help - 5 X DataBook Text font size: X ticks: Horizontal |X-axis Y-axis Z-axis StatAdvisor 3 04 7 0 % 42 7 |Label: Row: MQ Q Q Q 4 0 Reset StatGallery StatReporter StatFolio Comments StatLog Simple Regression - Puls Residual Plot Pulse2 = 18.4707 + 1.00603*Pulse1 30 20 C 10 residual 0 -10 D -20 -30 58 68 78 88 98 108 Pulse1 Click on a menu it with the r button to display NUMit P P en BONNY L AHWSRegr (Pulse).p.. STATGRAPHICS Cen. V ENG 20:41 STATGRAPHICS Centurion - Untitled StatFolio X File Edit Plot Describe Compare Relate Forecast SPC DOE SnapStats!! Statlets Tools View Window Help DataBook : 6 46 0 8 |Text font size: 1 X ticks: Horizontal |X-axis Y-axis Z-axis StatAdvisor |Label: Row: Q Q 4 8 Reset StatGallery StatReporter One Variable Analysis - RESIDUALS StatFolio Comments StatLog Simple Regression - Puls One Variable Analysis - Density Trace 0.03 TT 0.025 0.02 density 0.015 0.01 - 0.005 -28 -18 -8 2 12 22 32 RESIDUALS Click on a menu item with the right mouse button to display docu NUM


