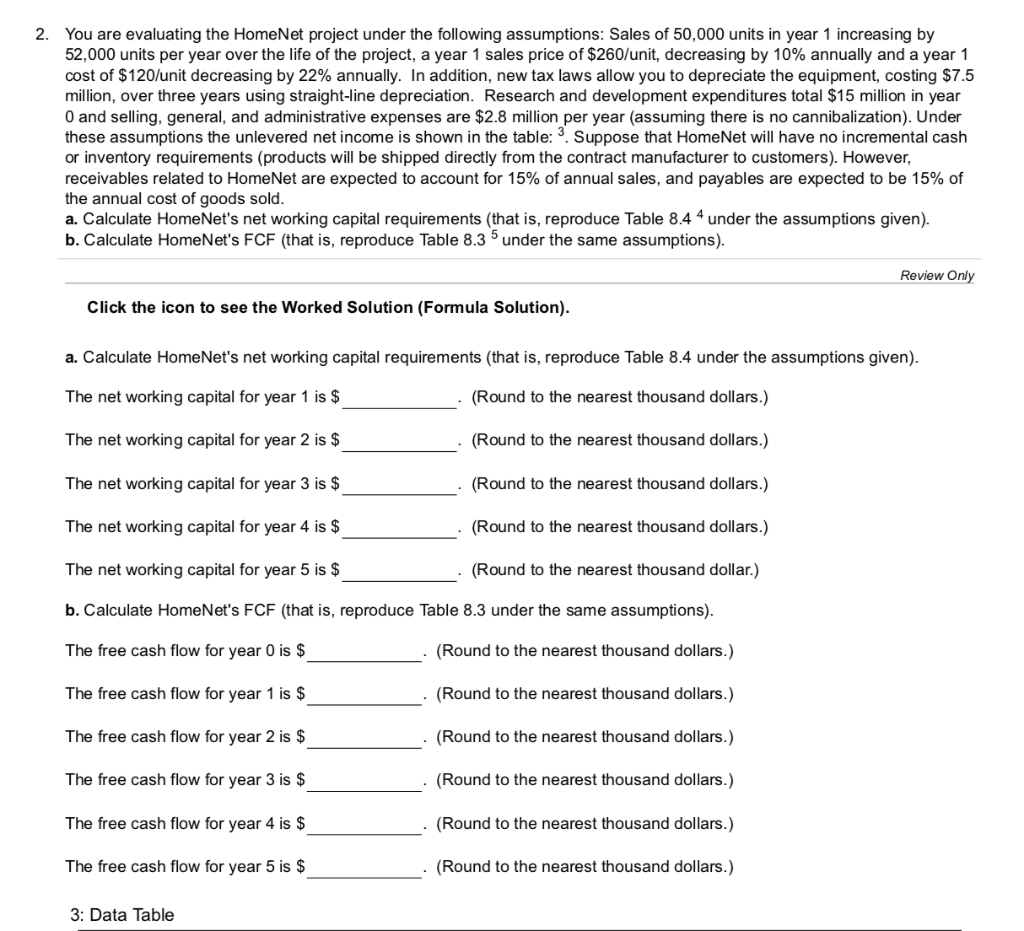
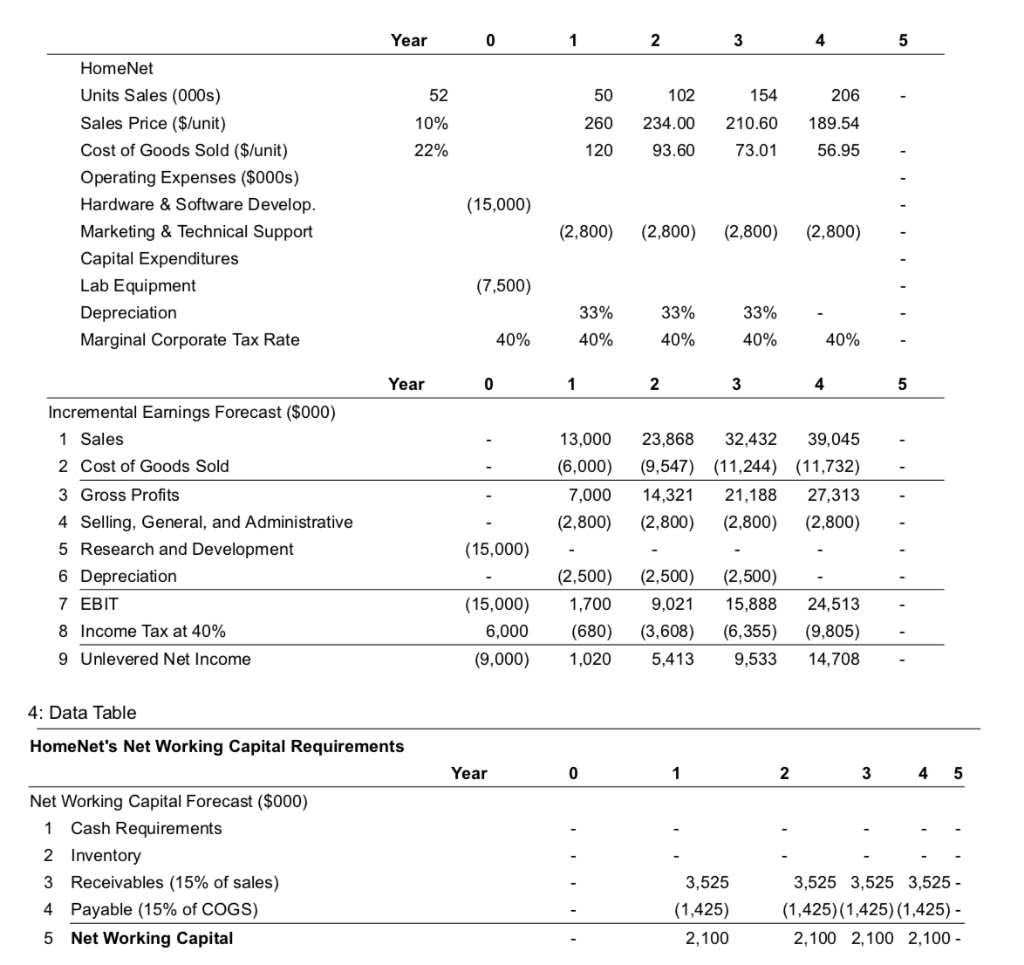
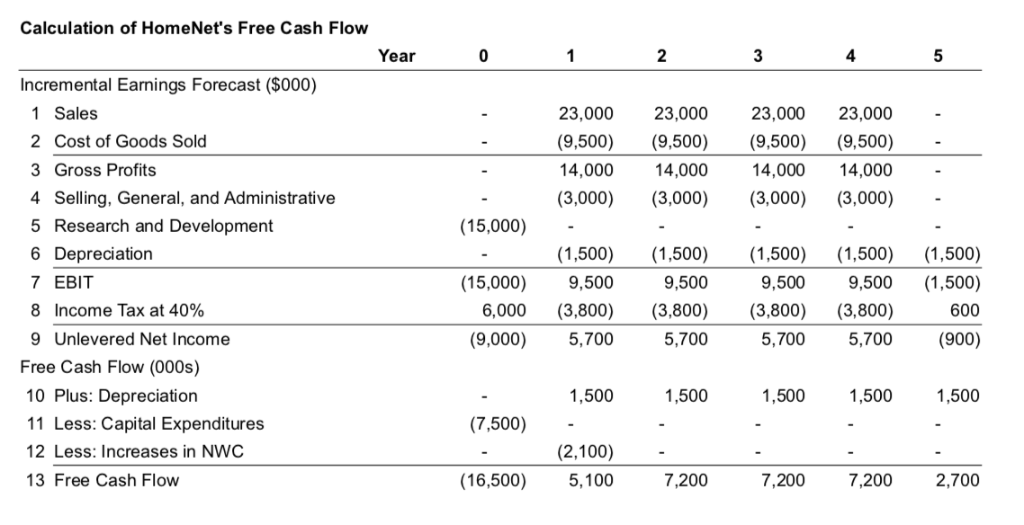
2. You are evaluating the HomeNet project under the following assumptions: Sales of 50,000 units in year 1 increasing by 52,000 units per year over the life of the project, a year 1 sales price of $260/unit, decreasing by 10% annually and a year 1 cost of $120/unit decreasing by 22% annually. In addition, new tax laws allow you to depreciate the equipment, costing $7.5 million, over three years using straight-line depreciation. Research and development expenditures total $15 million in year 0 and selling, general, and administrative expenses are $2.8 million per year (assuming there is no cannibalization). Under these assumptions the unlevered net income is shown in the table:. Suppose that HomeNet will have no incremental cash or inventory requirements (products will be shipped directly from the contract manufacturer to customers). However, receivables related to HomeNet are expected to account for 15% of annual sales, and payables are expected to be 15% of the annual cost of goods solo a. Calculate HomeNet's net working capital requirements (that is, reproduce Table 8.4 4 under the assumptions given). b. Calculate HomeNet's FCF (that is, reproduce Table 8.3 under the same assumptions). Review O Click the icon to see the Worked Solution (Formula Solution). a. Calculate HomeNet's net working capital requirements (that is, reproduce Table 8.4 under the assumptions given) The net working capital for year 1 is $ The net working capital for year 2 is $ The net working capital for year 3 is $ The net working capital for year 4 is $ The net working capital for year 5 is $ b. Calculate HomeNet's FCF (that is, reproduce Table 8.3 under the same assumptions) The free cash flow for year 0 is $ The free cash flow for year 1 is $ The free cash flow for year 2 is $ The free cash flow for year 3 is $ The free cash flow for year 4 is $ The free cash flow for year 5 is $ 3: Data Table Round to the nearest thousand dollars.) Round to the nearest thousand dollars.) . (Round to the nearest thousand dollars.) Round to the nearest thousand dollars.) Round to the nearest thousand dollar.) Round to the nearest thousand dollars.) Round to the nearest thousand dollars.) Round to the nearest thousand dollars.) Round to the nearest thousand dollars.) (Round to the nearest thousand dollars.) (Round to the nearest thousand dollars.) Year 4 HomeNet Units Sales (000s) Sales Price (S/unit) Cost of Goods Sold (S/unit) Operating Expenses ($000s) Hardware & Software Develop Marketing & Technical Support Capital Expenditures Lab Equipment Depreciation Marginal Corporate Tax Rate 52 10% 22% 206 260 234.00 210.60 189.54 120 93.60 73.01 56.95 50 102 154 (15,000) (2,800) (2,800) (2,800) (2,800) (7,500) 33% 33% 33% 40% 40% Year 3 4 Incremental Eanings Forecast ($000) 1 Sales 2 Cost of Goods Sold 3Gross Profits 4 Selling, General, and Administrative 5 Research and Development 6 Depreciation 7 EBIT 8 Income Tax at 40% 9 Unlevered Net Income 13,000 23,868 32,432 39,045 (6,000) (9,547) (11,244) (11,732) 7,000 14,32121,188 27,313 (2,800) 2,800 2,800) (2,800) - (15,000) (2,500) (2,500 (2,500) 15,000 1,700 9,021 15,888 24,513- 6,000 (680) (3,608) (6,355) (9,805) (9,000) 020 5,413 9,533 14,708 4: Data Table HomeNet's Net Working Capital Requirements Year 2 Net Working Capital Forecast ($000) 1 2 3 4 5 Cash Requirements Inventory Receivables (15% of sales) Payable (15% of COGS) Net Working Capital 3,525 (1,425) 2,100 3,525 3,525 3,525 - (1,425)(1,425) (1,425) - 2,100 2,100 2,100 Calculation of HomeNet's Free Cash Flow Year 1 2 4 Incremental Earnings Forecast ($000) 1 Sales 2 Cost of Goods Sold 3 Gross Profits 4 Selling, General, and Administrativee 5 Research and Development 6 Depreciation 7 EBIT 8 Income Tax at 40% 9 Unlevered Net Income 23,000 23,000 (9,500)(9,500) 9,500) (9,500) 14,000 (3,000) (3,000) 3,000) (3,000) 23,000 23,000 14,000 4,000 14,000 15,000) - 1,500) ,500) 1,500) 1,500) 1,500) 15,000) 9,500 9,500 9,500 9,500 1,500) 600 5,700 5,700 (900) 6,000 (3,800 (3,800) (3,800) (3,800) 5,700 (9,000) 5,700 Free Cash Flow (000s) 1,500 10 Plus: Depreciation 11 Less: Capital Expenditures 12 Less: Increases in NWC 13 Free Cash Flow 1,500 1,500 1,500 1,500 (7,500) (2,100) 16,500 5,100 7,200 7,2007,200 2,700