20. Describe in two complete sentences what the profit margin ratio
measures. (4 pts)
21. Which company has a better profit margin ratio? (1 pts). Why is this
important to you? (Three complete sentences are required) (3pts)
22. How did the Famous Dave's management describe the current year as
compared to prior years? What are their plans for the future? THREE
FULL PARAGRAPHS REQUIRED (5 pts.) The answer must be typed and
in your own words. If you copy it directly from the annual report, you will
receive zero points
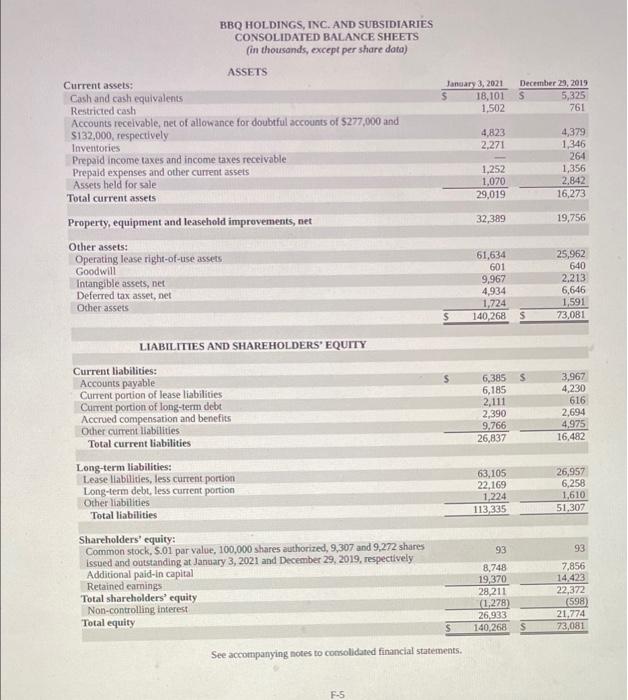
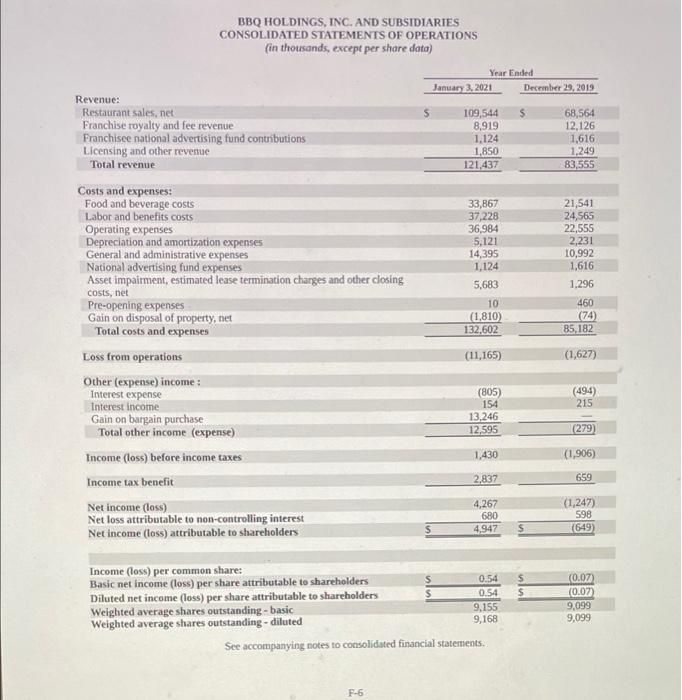
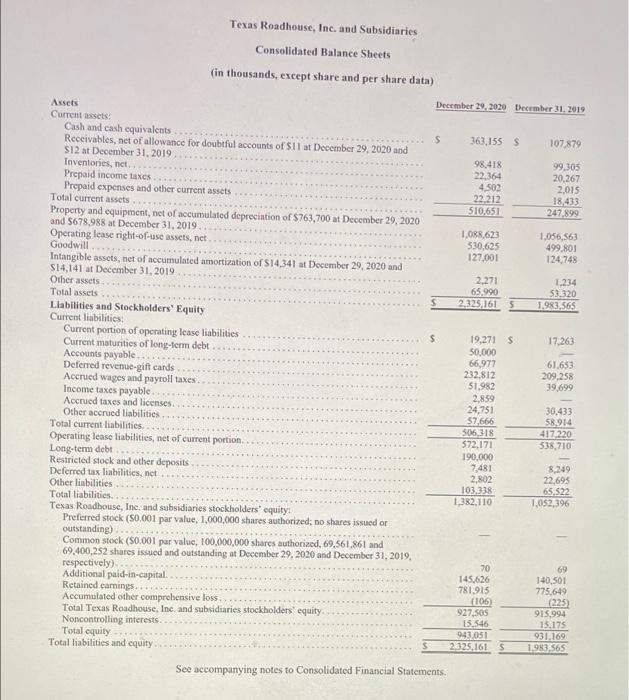
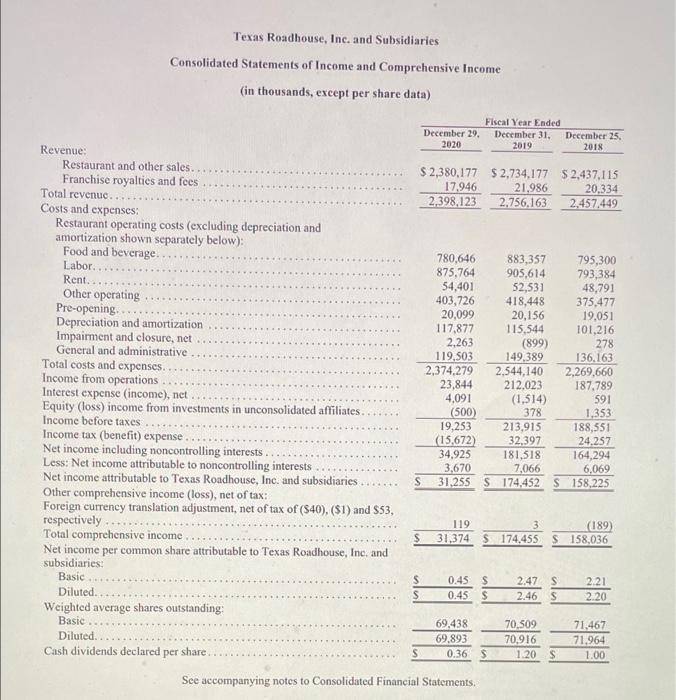
BBQ HOLDINGS, INC. AND SUBSIDIARIES CONSOLIDATED BALANCE SHEETS (in thousands, except per share data) ASSETS Current assets; Cash and cash equivalents Restricted cash Accounts receivable, net of allowance for doubtful accounts of $277,000 and $132,000, respectively Inventories Prepaid income taxes and income taxes receivable Prepaid expenses and other current assets Assets held for sale Total current assets i Property, equipment and leasehold improvements, net Other assets: Operating lease right-of-use assets Goodwill Intangible assets, net Deferred tax asset, net Ocher assets LIABILITIES AND SHAREHOLDERS' EQUITY Current liabilities: Accounts payable Current portion of lease liabilities Current portion of long-term debt Accrued compensation and benefits Other current liabilities Total current liabilities Long-term liabilities: Lease liabilities, less current portion Long-term debt, less current portion Other liabilities Total liabilities Shareholders' equity: Common stock, $.01 par value, 100,000 shares authorized, 9,307 and 9,272 shares issued and outstanding at January 3, 2021 and December 29, 2019, respectively Additional paid-in capital Retained earnings Total shareholders' equity Non-controlling interest Total equity January 3, 2021 18,101 1,502 4,823 2,271 1,252 1,070 29,019 32,389 61,634 601 9,967 4,934 1,724 140,268 $ See accompanying notes to consolidated financial statements. F-S December 29, 2019 S 5,325 761 4,379 1,346 264 1,356 2,842 16,273 19,756 25,962 640 2,213 6,646 1,591 73,081 3,967 4,230 616 2,694 4,975 16,482 26,957 6,258 1,610 51,307 93 7,856 14,423 22,372 (598) 21,774 73,081 S 6,385 S 6,185 2,111 2,390 9,766 26,837 63,105 22,169 1,224 113,335 93 8,748 19,370 28,211 (1,278) 26,933 140,268 $ BBQ HOLDINGS, INC. AND SUBSIDIARIES CONSOLIDATED STATEMENTS OF OPERATIONS (in thousands, except per share data) January 3, 2021 Revenue: Restaurant sales, net Franchise royalty and fee revenue Franchisee national advertising fund contributions Licensing and other revenue Total revenue Costs and expenses: Food and beverage costs Labor and benefits costs Operating expenses Depreciation and amortization expenses General and administrative expenses National advertising fund expenses Asset impairment, estimated lease termination charges and other closing costs, net Pre-opening expenses Gain on disposal of property, net Total costs and expenses Loss from operations Other (expense) income: Interest expense Interest income Gain on bargain purchase Total other income (expense) Income (loss) before income taxes Income tax benefit Net income (loss) Net loss attributable to non-controlling interest Net income (loss) attributable to shareholders Income (loss) per common share: Basic net income (loss) per share attributable to shareholders Diluted net income (loss) per share attributable to shareholders Weighted average shares outstanding-basic Weighted average shares outstanding-diluted Year Ended 109,544 8,919 1,124 1,850 121,437 33,867 37,228 36,984 5,121 14,395 1,124 5,683 10 (1,810) 132,602 (11,165) (805) 154 13,246 12,595 1,430 2,837 4,267 680 4,947 0.54 S 0.54 $ 9,155 9,168 See accompanying notes to consolidated financial stateme ts. F-6 December 29, 2019 68,564 12,126 1,616 1,249 83,555 21,541 24,565 22,555 2,231 10,992 1,616 1,296 460 (74) 85,182 (1,627) (494) 215 (279) (1,906) 659 (1,247) 598 (649) (0.07) (0.07) 9,099 9,099 Texas Roadhouse, Inc. and Subsidiaries Consolidated Balance Sheets (in thousands, except share and per share data) December 29, 2020 December 31, 2019 Cash and cash equivalents S 363,155 S 107,879 Receivables, net of allowance for doubtful accounts of $11 at December 29, 2020 and $12 at December 31, 2019. 98,418 99,305 Inventories, net. 22,364 20,267 Prepaid income taxes 4,502 2,015 Prepaid expenses and other current assets. 22,212 Total current assets..... 18,433 510,651 247,899 Property and equipment, net of accumulated depreciation of $763,700 at December 29, 2020 and $678,988 at December 31, 2019. 1,088,623 1,056,563 Operating lease right-of-use assets, net. Goodwill 530,625 499,801 127,001 124,748 Intangible assets, net of accumulated amortization of $14,341 at December 29, 2020 and $14,141 at December 31, 2019 2,271 1,234 Other assets.. 65,990 53.320 Total assets 2,325,161 S 1,983,565 Liabilities and Stockholders' Equity Current liabilities: 19,271 S 17,263 Current portion of operating lease liabilities Current maturities of long-term debt Accounts payable.. 50,000 66,977 61,653 Deferred revenue-gift cards Accrued wages and payroll taxes. 232,812 209,258 51,982 39,699 Income taxes payable. 2,859 Accrued taxes and licenses. Other accrued liabilities. 24,751 30,433 57,666 58,914 Total current liabilities. 506,318 417,220 Operating lease liabilities, net of current portion.. 572,171 538,710 Long-term debt 190,000 Restricted stock and other deposits 7,481 8,249 Deferred tax liabilities, net 2,802 22,695 Other liabilities 103,338 65,522 Total liabilities.. 1,382,110 1,052,396 Texas Roadhouse, Inc. and subsidiaries stockholders' equity: Preferred stock ($0.001 par value, 1,000,000 shares authorized; no shares issued or outstanding) Common stock ($0.001 par valuc, 100,000,000 shares authorized, 69,561,861 and 69,400,252 shares issued and outstanding at December 29, 2020 and December 31, 2019, respectively). 70 69 Additional paid-in-capital. 145,626 140,501 Retained earnings.. 781,915 775,649 Accumulated other comprehensive loss. (106) (225) Total Texas Roadhouse, Inc, and subsidiaries stockholders' equity. 927,505 915,994 15,546 15.175 Noncontrolling interests. Total equity 943,051 931,169 Total liabilities and equity. 2.325,161 S 1,983.565 See accompanying notes to Consolidated Financial Statements. Assets Current assets: Texas Roadhouse, Inc. and Subsidiaries Consolidated Statements of Income and Comprehensive Income (in thousands, except per share data) December 29, 2020 Fiscal Year Ended December 31, 2019 $2,380,177 $2,734,177 17,946 21,986 2,398,123 2,756,163 780,646 883,357 875,764 905,614 54,401 52,531 403,726 418,448 20,099 20,156 117,877 115,544 2,263 (899) 119,503 149,389 2,374,279 2,544,140 23,844 212,023 4,091 Revenue: Restaurant and other sales. Franchise royalties and fees Total revenue.. Costs and expenses: Restaurant operating costs (excluding depreciation and amortization shown separately below): Food and beverage. Labor. Rent. Other operating Pre-opening... Depreciation and amortization Impairment and closure, net General and administrative Total costs and expenses.. Income from operations. Interest expense (income), net. Equity (loss) income from investments in unconsolidated affiliates. Income before taxes Income tax (benefit) expense... Net income including noncontrolling interests. Less: Net income attributable to noncontrolling interests S Net income attributable to Texas Roadhouse, Inc. and subsidiaries. Other comprehensive income (loss), net of tax: Foreign currency translation adjustment, net of tax of ($40), ($1) and $53, respectively Total comprehensive income $ Net income per common share attributable to Texas Roadhouse, Inc. and subsidiaries: Basic S Diluted. S Weighted average shares outstanding: Basic Diluted.. Cash dividends declared per share. December 25, 2018 $2,437,115 20,334 2,457,449 795,300 793,384 48,791 375,477 19,051 101,216 278 136,163 2,269,660 187,789 (1,514) 591 378 1,353 19,253 213,915 188,551 (15,672) 32,397 24,257 34,925 181,518 164,294 7,066 6,069 3,670 31,255 S 174,452 S 158,225 119 (189) 31,374 $ 174,455 $ 158,036 0.45 S 2.47 S 2.21 0.45 S 2.46 S 2.20 71,467 71,964 1.00 (500) 69,438 69,893 S 0.36 S See accompanying notes to Consolidated Financial Statements. 70,509 70,916 1.20 S