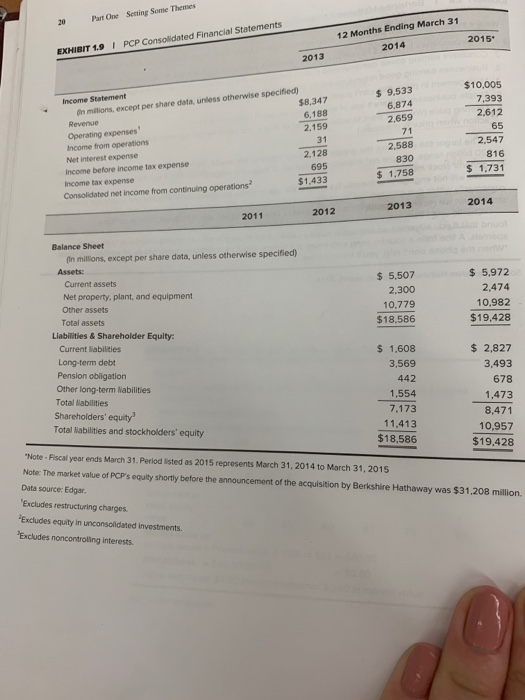
20 Part One Setting Some Themes PCP Consolidated Financial Statements 12 Months Ending March 31 2014 2015 EXHIBIT 1.9 2013 $ 9.533 6,874 2,659 $10,005 7,393 2.612 65 Income Statement A milions, except per share data, unless otherwise specified) $8.347 Revenue 6,188 Operating expenses 2.159 Income from operations Net interest expense Income before income tax expense Income tax expense 695 Consolidated net income from continuing operations 2,128 2,588 830 $ 1.758 2,547 816 $ 1.731 ons? $1,433 2014 2013 2011 2012 $ 5,507 2,300 10.779 $18.586 $ 5,972 2,474 10.982 $19,428 Balance Sheet in milions, except per share data, unless otherwise specified) Assets: Current assets Net property, plant, and equipment Other assets Total assets Liabilities & Shareholder Equity Current liabilities Long-term debt Pension obligation Other long-term liabilities Total liabilities Shareholders' equity Total abilities and stockholders' equity $ 1.608 3,569 442 1,554 7.173 11,413 $18,586 $ 2,827 3,493 678 1,473 8,471 10,957 $19.428 "Note Fiscal year ends March 31. Periodisted as 2015 represents March 31, 2014 to March 31, 2015 Note: The market value of PCP's equity shortly before the announcement of the acquisition by Berkshire Hathaway was $31,208 million. Data source: Edgar. 'Excludes restructuring charges. Excludes equity in unconsolidated investments. "Excludes no controlling interests. Using Exh 1.9, compute PCP's changes in shareholder equities between 2014 and 2015. Round and enter the answer to nearest 20 Part One Setting Some Themes PCP Consolidated Financial Statements 12 Months Ending March 31 2014 2015 EXHIBIT 1.9 2013 $ 9.533 6,874 2,659 $10,005 7,393 2.612 65 Income Statement A milions, except per share data, unless otherwise specified) $8.347 Revenue 6,188 Operating expenses 2.159 Income from operations Net interest expense Income before income tax expense Income tax expense 695 Consolidated net income from continuing operations 2,128 2,588 830 $ 1.758 2,547 816 $ 1.731 ons? $1,433 2014 2013 2011 2012 $ 5,507 2,300 10.779 $18.586 $ 5,972 2,474 10.982 $19,428 Balance Sheet in milions, except per share data, unless otherwise specified) Assets: Current assets Net property, plant, and equipment Other assets Total assets Liabilities & Shareholder Equity Current liabilities Long-term debt Pension obligation Other long-term liabilities Total liabilities Shareholders' equity Total abilities and stockholders' equity $ 1.608 3,569 442 1,554 7.173 11,413 $18,586 $ 2,827 3,493 678 1,473 8,471 10,957 $19.428 "Note Fiscal year ends March 31. Periodisted as 2015 represents March 31, 2014 to March 31, 2015 Note: The market value of PCP's equity shortly before the announcement of the acquisition by Berkshire Hathaway was $31,208 million. Data source: Edgar. 'Excludes restructuring charges. Excludes equity in unconsolidated investments. "Excludes no controlling interests. Using Exh 1.9, compute PCP's changes in shareholder equities between 2014 and 2015. Round and enter the answer to nearest


