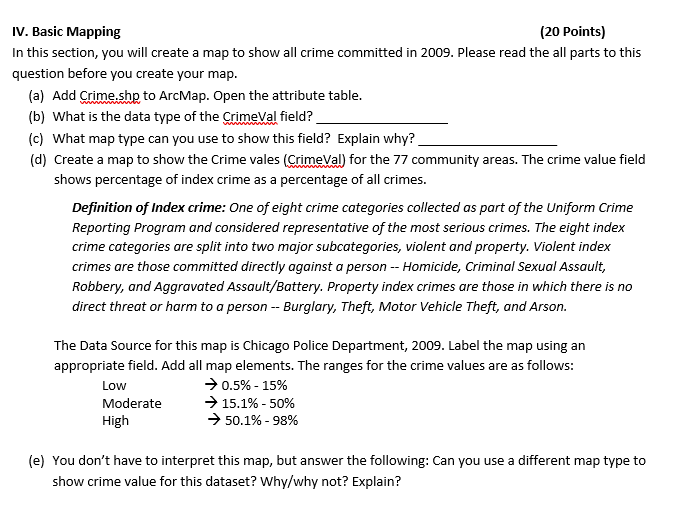
(20 Points) IV. Basic Mapping In this section, you will create a map to show all crime committed in 2009. Please read the all parts to this question before you create your map (a) Add Crime.shp to ArcMap. Open the attribute table (b) What is the data type of the CrimeVal field? (c) What map type can you use to show this field? Explain why? (d) Create a map to show the Crime vales (CrimeVal) for the 77 community areas. The crime value field shows percentage of index crime as a percentage of all crimes. Definition of Index crime: One of eight crime categories collected as part of the Uniform Crime Reporting Program and considered representative of the most serious crimes. The eight index crime categories are split into two major subcategories, violent and property. Violent index crimes are those committed directly against a person - - Homicide, Criminal Sexual Assault, Robbery, and Aggravated Assault/Battery. Property index crimes are those in which there is no direct threat or harm to a person - Burglary, Theft, Motor Vehicle Theft, and Arson. The Data Source for this map is Chicago Police Department, 2009. Label the map using ar appropriate field. Add all map elements. The ranges for the crime values are as follows Low Moderate High 0.5%-15% 15.1%-50% 50.1%-98% (e) You don't have to interpret this map, but answer the following: Can you use a different map type to show crime value for this dataset? Why/why not? Explain? (20 Points) IV. Basic Mapping In this section, you will create a map to show all crime committed in 2009. Please read the all parts to this question before you create your map (a) Add Crime.shp to ArcMap. Open the attribute table (b) What is the data type of the CrimeVal field? (c) What map type can you use to show this field? Explain why? (d) Create a map to show the Crime vales (CrimeVal) for the 77 community areas. The crime value field shows percentage of index crime as a percentage of all crimes. Definition of Index crime: One of eight crime categories collected as part of the Uniform Crime Reporting Program and considered representative of the most serious crimes. The eight index crime categories are split into two major subcategories, violent and property. Violent index crimes are those committed directly against a person - - Homicide, Criminal Sexual Assault, Robbery, and Aggravated Assault/Battery. Property index crimes are those in which there is no direct threat or harm to a person - Burglary, Theft, Motor Vehicle Theft, and Arson. The Data Source for this map is Chicago Police Department, 2009. Label the map using ar appropriate field. Add all map elements. The ranges for the crime values are as follows Low Moderate High 0.5%-15% 15.1%-50% 50.1%-98% (e) You don't have to interpret this map, but answer the following: Can you use a different map type to show crime value for this dataset? Why/why not? Explain


