Answered step by step
Verified Expert Solution
Link Copied!

Question

1 Approved Answer

(20 points) There are 4 machines. A part moves through each machine automatically. The machining times and automated set up times for each part are
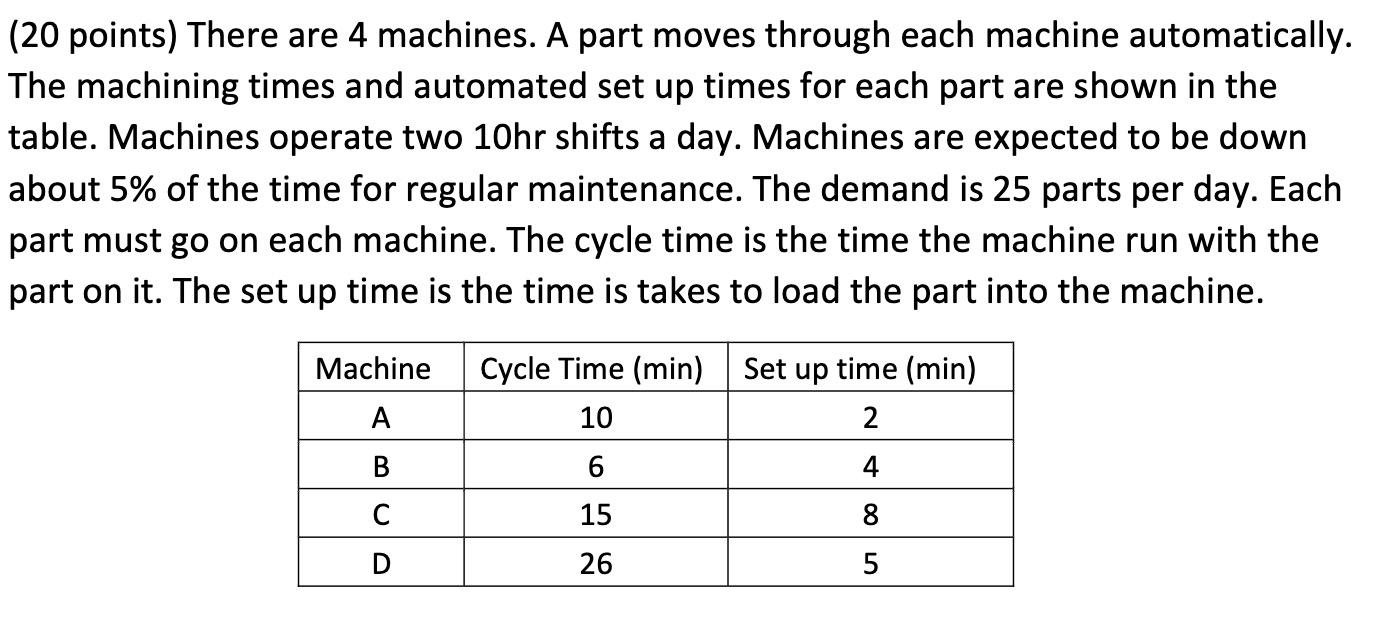
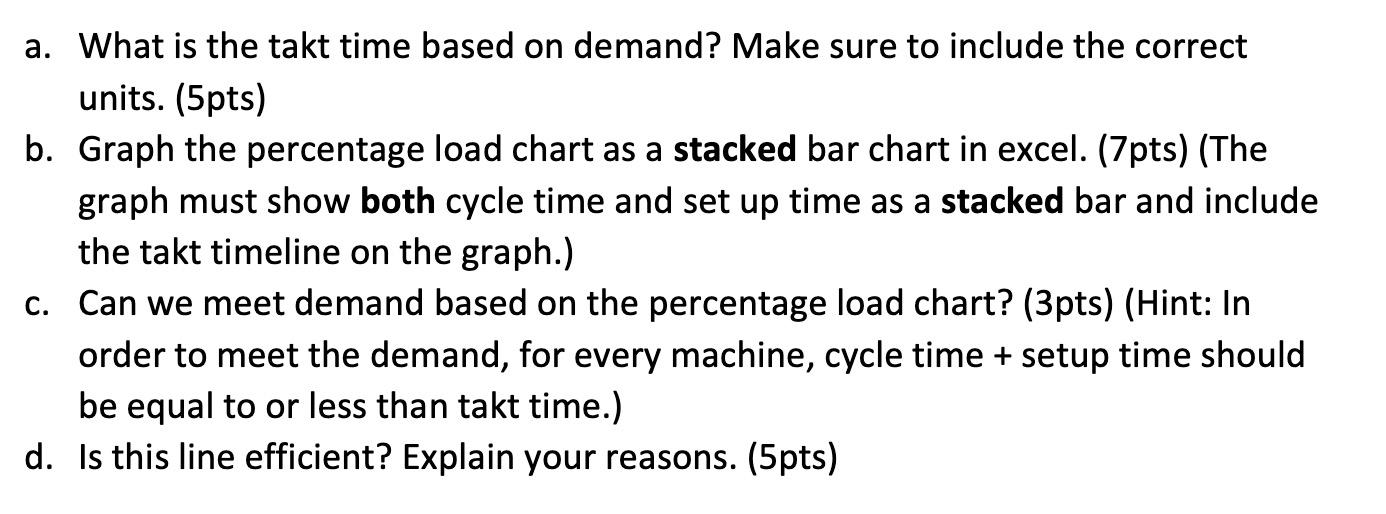
image text in transcribedimage text in transcribed

(20 points) There are 4 machines. A part moves through each machine automatically. The machining times and automated set up times for each part are shown in the table. Machines operate two 10hr shifts a day. Machines are expected to be down about 5% of the time for regular maintenance. The demand is 25 parts per day. Each part must go on each machine. The cycle time is the time the machine run with the part on it. The set up time is the time is takes to load the part into the machine. a. What is the takt time based on demand? Make sure to include the correct units. (5pts) b. Graph the percentage load chart as a stacked bar chart in excel. (7pts) (The graph must show both cycle time and set up time as a stacked bar and include the takt timeline on the graph.) c. Can we meet demand based on the percentage load chart? (3pts) (Hint: In order to meet the demand, for every machine, cycle time + setup time should be equal to or less than takt time.) d. Is this line efficient? Explain your reasons. (5pts) (20 points) There are 4 machines. A part moves through each machine automatically. The machining times and automated set up times for each part are shown in the table. Machines operate two 10hr shifts a day. Machines are expected to be down about 5% of the time for regular maintenance. The demand is 25 parts per day. Each part must go on each machine. The cycle time is the time the machine run with the part on it. The set up time is the time is takes to load the part into the machine. a. What is the takt time based on demand? Make sure to include the correct units. (5pts) b. Graph the percentage load chart as a stacked bar chart in excel. (7pts) (The graph must show both cycle time and set up time as a stacked bar and include the takt timeline on the graph.) c. Can we meet demand based on the percentage load chart? (3pts) (Hint: In order to meet the demand, for every machine, cycle time + setup time should be equal to or less than takt time.) d. Is this line efficient? Explain your reasons. (5pts)

Step by Step Solution

There are 3 Steps involved in it

Step: 1

blur-text-image

Get Instant Access to Expert-Tailored Solutions

See step-by-step solutions with expert insights and AI powered tools for academic success

Step: 2

blur-text-image

Step: 3

blur-text-image

Ace Your Homework with AI

Get the answers you need in no time with our AI-driven, step-by-step assistance

Get Started

Recommended Textbook for

More Books

Students also viewed these Accounting questions

Question

2. List the advantages of listening well

Answered: 1 week ago