Answered step by step
Verified Expert Solution
Link Copied!

Question

1 Approved Answer

(20 pts) Using a computer tool such as Excel or Matlab, generate a plot of a first order response where the horizontal axis ist/tau (where
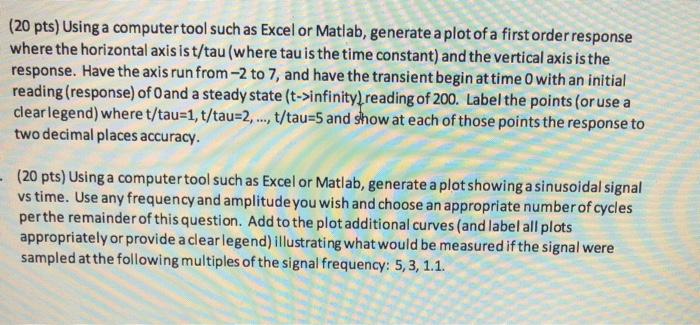
image text in transcribed
(20 pts) Using a computer tool such as Excel or Matlab, generate a plot of a first order response where the horizontal axis ist/tau (where tau is the time constant) and the vertical axis is the response. Have the axis run from -2 to 7, and have the transient begin at time with an initial reading (response) of Oand a steady state (t->infinity, reading of 200. Label the points (or use a clear legend) where t/tau=1,t/tau=2, ..., t/tau=5 and show at each of those points the response to two decimal places accuracy. (20 pts) Using a computertool such as Excel or Matlab, generate a plot showing a sinusoidal signal vs time. Use any frequency and amplitude you wish and choose an appropriate number of cycles per the remainder of this question. Add to the plot additional curves (and label all plots appropriately or provide a clear legend) illustrating what would be measured if the signal were sampled at the following multiples of the signal frequency: 5, 3

Step by Step Solution

There are 3 Steps involved in it

Step: 1

blur-text-image

Get Instant Access to Expert-Tailored Solutions

See step-by-step solutions with expert insights and AI powered tools for academic success

Step: 2

blur-text-image_2

Step: 3

blur-text-image_3

Ace Your Homework with AI

Get the answers you need in no time with our AI-driven, step-by-step assistance

Get Started

Recommended Textbook for

More Books

Students also viewed these Databases questions

Question

Employ effective vocal cues Employ effective visual cues

Answered: 1 week ago