

Answered step by step
Verified Expert Solution
Question
1 Approved Answer
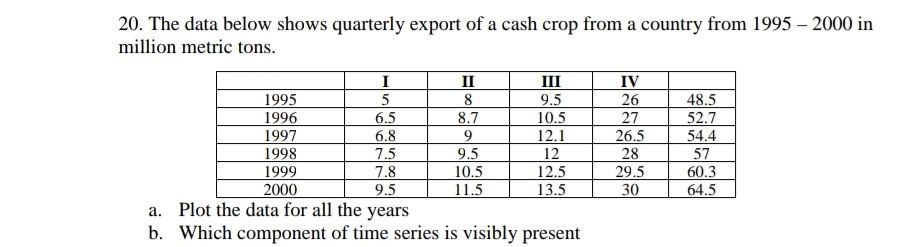
20. The data below shows quarterly export of a cash crop from a country from 1995 - 2000 in million metric tons. II III IV
Step by Step Solution
There are 3 Steps involved in it
Step: 1

Get Instant Access to Expert-Tailored Solutions
See step-by-step solutions with expert insights and AI powered tools for academic success
Step: 2

Step: 3
Ace Your Homework with AI
Get the answers you need in no time with our AI-driven, step-by-step assistance
Get Started
Calculus
Authors: Laura Taalman, Peter Kohn
1st Edition
1464153035, 9781464153037