Answered step by step
Verified Expert Solution
Link Copied!

Question

1 Approved Answer

20. The data below shows quarterly export of a cash crop from a country from 1995 - 2000 in million metric tons. II III IV
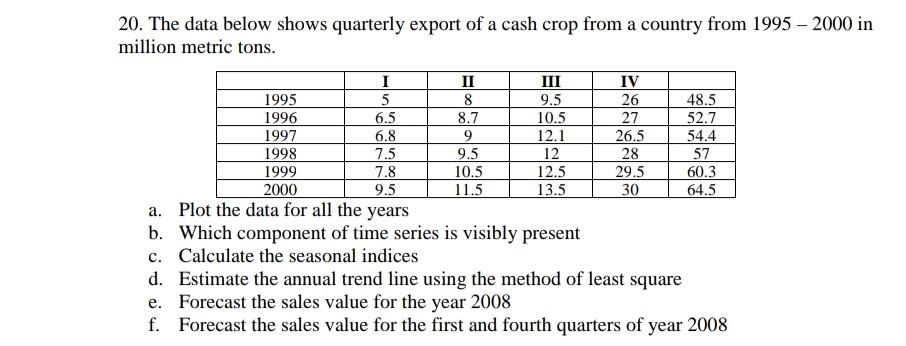
image text in transcribed
20. The data below shows quarterly export of a cash crop from a country from 1995 - 2000 in million metric tons. II III IV 1995 5 8 9.5 26 48.5 1996 6.5 8.7 10.5 27 52.7 1997 6.8 9 12.1 26.5 54.4 1998 7.5 95 12 28 57 1999 7.8 10.5 12.5 29.5 60.3 2000 9.5 11.5 13.5 30 64.5 a. Plot the data for all the years b. Which component of time series is visibly present c. Calculate the seasonal indices d. Estimate the annual trend line using the method of least square e. Forecast the sales value for the year 2008 f. Forecast the sales value for the first and fourth quarters of year 2008

Step by Step Solution

There are 3 Steps involved in it

Step: 1

blur-text-image

Get Instant Access to Expert-Tailored Solutions

See step-by-step solutions with expert insights and AI powered tools for academic success

Step: 2

blur-text-image

Step: 3

blur-text-image

Ace Your Homework with AI

Get the answers you need in no time with our AI-driven, step-by-step assistance

Get Started

Recommended Textbook for

Applied Calculus

Authors: Stefan Waner, Steven Costenoble

7th Edition

1337514306, 9781337514309

More Books

Students also viewed these Mathematics questions

Question

Can workers be trained in ethics? How? Defend your answer.

Answered: 1 week ago