

Answered step by step
Verified Expert Solution
Question
1 Approved Answer
20. x 2 / 13 74.5% Question 1: (Probejava) Prior to departing space dock, the USS Equinox sent long-range probes to several quadrants of the
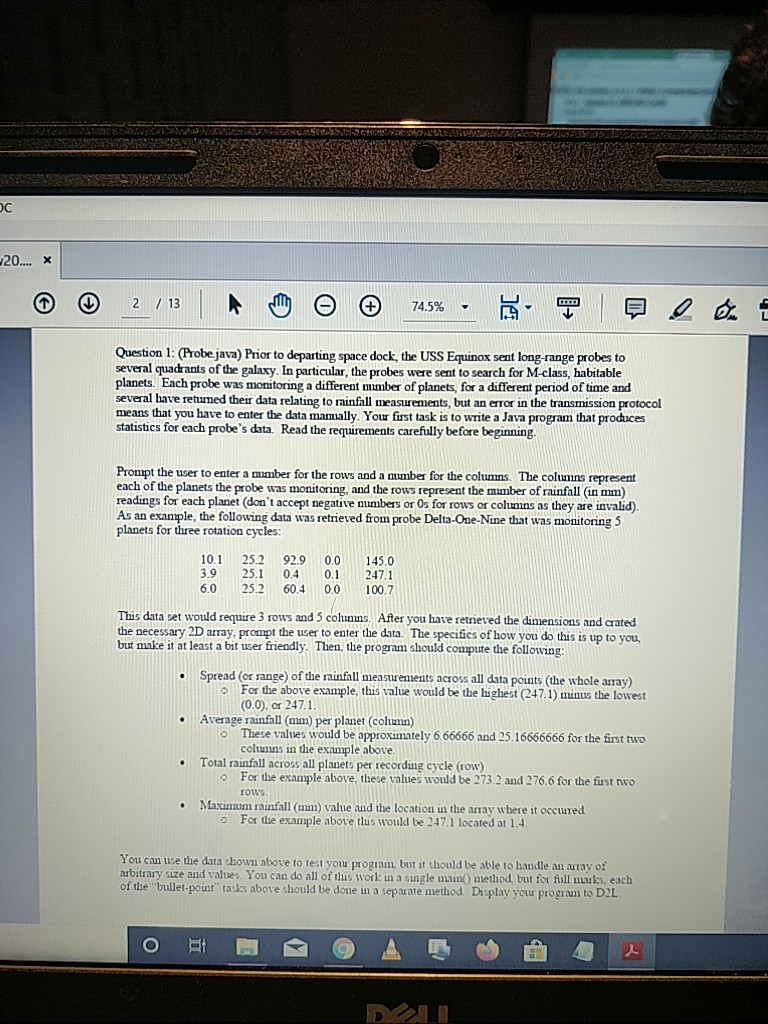
20. x 2 / 13 74.5% Question 1: (Probejava) Prior to departing space dock, the USS Equinox sent long-range probes to several quadrants of the galaxy. In particular, the probes were sent to search for M-class, habitable planets. Each probe was monitoring a different mumber of planets, for a different period of time and several have retumed their data relating to rainfall measurements, but an error in the transmission protocol means that you have to enter the data mamually. Your first task is to write a Java program that produces statistics for each probe's data. Read the requirements carefully before beginning. Prompt the user to enter a mumber for the rows and a mumber for the columns. The columns represent each of the planets the probe was monitoring, and the rows represent the mumber of rainfall (in mm) readings for each planet (don't accept negative numbers or Os for rows or columns as they are invalid). As an example, the following data was retrieved from probe Delta-One-Nine that was monitoring 5 planets for three rotation cycles: 10.1 3.9 25.2 92.9 0.0 0.4 60.4 145.0 247.1 100.7 0.1 25.1 6.0 25.2 0.0 This data set would require 3 rows and 5 colunns. After you have retrieved the dimensions and crated the necessary 2D array, prompt the user to enter the data. The specifics of how you do this is up to you, but make it at least a bit user friendly. Then, the program should compute the following: Spread (or range) of the rainfall measurements across all data points (the whole array) o For the above example, this value would be the highest (247.1) minus the lowest (0.0). or 247.1, Average rainfall (nm) per planet (column) O These values would be approximately 6.66666 and 25.16666666 for the first two colunns in the example above. Total rainfall across all planets per recording cycle (row) o For the example above, these values would be 273.2 and 276.6 for the first nwo rows. Maxinum rainfall (mm) valuue and the location in the array where it occured o For the example above this would be 247.1 located at 1,4. You can use the data shown above to test your program but it should be able to handle an array of arbitrary size and values. You can do all of this work in a single main() method, but for fiall mauks, each of the "bullet-point" tasks above should be done in a separate method. Display yvour program to D2L
Step by Step Solution
There are 3 Steps involved in it
Step: 1

Get Instant Access to Expert-Tailored Solutions
See step-by-step solutions with expert insights and AI powered tools for academic success
Step: 2

Step: 3
Ace Your Homework with AI
Get the answers you need in no time with our AI-driven, step-by-step assistance
Get Started
Excel As Your Database
Authors: Paul Cornell
1st Edition
1590597516, 978-1590597514