| 2005 | 11.88% | 28.06% | 44.74% | 65.12% | -3.83% | -0.80% | 11.99% | 10.93% | 2.23% | |
| 2006 | 17.61% | 33.43% | 1.71% | 12.02% | 60.28% | 5.79% | 36.03% | 31.32% | 48.38% | |
| 2007 | -4.26% | 29.02% | 35.35% | 8.76% | -16.98% | 21.02% | -17.88% | 26.61% | 0.78% | |
| 2008 | 51.88% | 41.45% | 24.87% | 11.44% | -39.27% | 22.48% | -7.30% | 29.57% | 22.20% | |
| 2009 | -4.86% | -19.83% | -23.62% | 0.73% | 20.74% | 18.15% | 77.99% | -9.85% | 2.18% | |
| 2010 | 22.42% | 67.53% | -41.39% | 64.69% | 71.60% | 20.67% | 30.05% | 12.75% | 11.64% | |
| 2011 | 14.88% | -2.83% | -29.73% | 13.10% | 36.90% | -6.85% | -31.35% | 41.69% | 9.62% | |
| 2012 | 62.68% | 40.18% | -28.75% | 23.40% | 2.26% | 37.38% | 6.39% | 29.99% | 10.93% | |
| 2013 | -7.16% | 52.68% | 39.84% | -38.61% | -15.80% | 8.32% | 60.54% | 48.08% | 24.16% | |
| 2014 | -1.78% | 42.20% | 47.57% | 22.63% | 42.08% | -32.02% | -8.94% | 14.92% | 42.08% | |
| 2015 | 7.61% | 24.67% | 33.63% | -2.75% | 39.74% | 32.54% | -31.07% | 42.65% | -6.99% | |
| 2016 | 22.78% | 31.64% | -13.79% | 0.41% | 4.11% | 58.56% | 15.45% | 2.66% | 47.79% | |
| 2017 | -6.41% | 30.32% | 5.65% | 15.82% | 26.04% | 32.14% | 50.65% | 66.90% | 7.07% | |
| 2018 | 23.65% | 0.39% | 3.79% | 41.63% | 28.54% | 38.08% | 56.74% | -10.09% | 15.37% | |
| 2019 | 13.25% | 11.95% | 7.28% | 31.94% | -6.25% | 54.92% | -10.34% | 18.40% | -3.67% | |
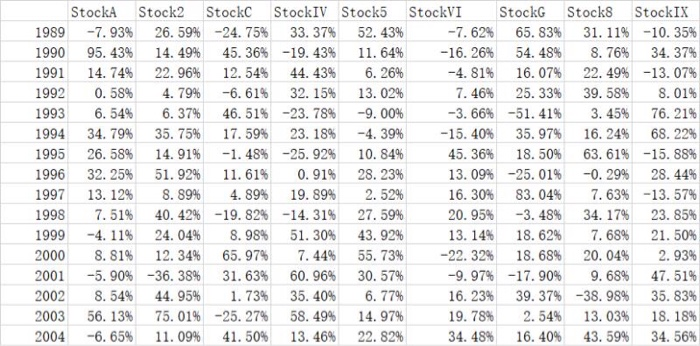
The tab labeled "DATA" contains 31 yearsof returns for nine securities. You are to calculate means and standard deviations, and develop the full square variance/covariance matrix, then do the following: 1. Using the matrix approach, develop a spreadsheet that calculates the nean and standard deviation of returns for an equally weighted portfolio of all nine stocks. 2. Using SOLVER, determine the weights in an efficient portfolio with a target return of 25%, allowing for short sales. Do the same, but DO NOT allow for short sales. StockA Stock2 1989 -7.93% 26. 59% 1990 95. 43% 14. 49% 1991 14.74% 22. 96% 1992 0.58% 4.79% 1993 6.54% 6. 37% 1994 34.79% 35. 75% 1995 26.58% 14.91% 1996 32. 25% 51.92% 1997 13.12% 8.89% 1998 7.51% 40.42% 1999 -4.11% 24.04% 2000 8.81% 12.34% 2001 -5.90% -36.38% 2002 8.54% 44.95% 2003 56. 13% 75.01% 2004 -6.65% 11.09% Stock -24.75% 45.36% 12.54% -6.61% 46.51% 17. 59% -1.48% 11. 61% 4.89% -19.82% 8.98% 65. 97% 31.63% 1.73% -25. 27% 41.50% StockIV Stock5 33. 37% 52. 43% -19.43% 11.64% 44. 43% 6.26% 32. 15% 13.02% -23. 78% -9.00% 23. 18% -4.39% -25.92% 10. 84% 0.91% 28. 23% 19. 89% 2.52% -14.31% 27. 59% 51. 30% 43. 92% 7.44% 55. 73% 60. 96% 30.57% 35.40% 6.77% 58. 49% 14.97% 13.46% 22. 82% StockVI Stock -7.62% 65. 83% -16.26% 54.48% -4.81% 16.07% 7.46% 25.33% -3.66% -51.41% -15. 40% 35. 97% 45.36% 18.50% 13.09% -25.01% 16. 30% 83.04% 20.95% -3.48% 13. 14% 18.62% -22.32% 18.68% -9.97% -17. 90% 16. 23% 39.37% 19.78% 2.54% 34.48% 16. 40% Stock8 StockIX 31. 11% -10.35% 8.76% 34.37% 22. 49% -13.07% 39.58% 8.01% 3.45% 76.21% 16. 24% 68.22% 63. 61% -15. 88% -0.29% 28.44% 7. 63% -13.57% 34.17% 23. 85% 7.68% 21. 50% 20.04% 2. 93% 9. 68% 47.51% -38. 98% 35. 83% 13.03% 18. 18% 43.59% 34.56% The tab labeled "DATA" contains 31 yearsof returns for nine securities. You are to calculate means and standard deviations, and develop the full square variance/covariance matrix, then do the following: 1. Using the matrix approach, develop a spreadsheet that calculates the nean and standard deviation of returns for an equally weighted portfolio of all nine stocks. 2. Using SOLVER, determine the weights in an efficient portfolio with a target return of 25%, allowing for short sales. Do the same, but DO NOT allow for short sales. StockA Stock2 1989 -7.93% 26. 59% 1990 95. 43% 14. 49% 1991 14.74% 22. 96% 1992 0.58% 4.79% 1993 6.54% 6. 37% 1994 34.79% 35. 75% 1995 26.58% 14.91% 1996 32. 25% 51.92% 1997 13.12% 8.89% 1998 7.51% 40.42% 1999 -4.11% 24.04% 2000 8.81% 12.34% 2001 -5.90% -36.38% 2002 8.54% 44.95% 2003 56. 13% 75.01% 2004 -6.65% 11.09% Stock -24.75% 45.36% 12.54% -6.61% 46.51% 17. 59% -1.48% 11. 61% 4.89% -19.82% 8.98% 65. 97% 31.63% 1.73% -25. 27% 41.50% StockIV Stock5 33. 37% 52. 43% -19.43% 11.64% 44. 43% 6.26% 32. 15% 13.02% -23. 78% -9.00% 23. 18% -4.39% -25.92% 10. 84% 0.91% 28. 23% 19. 89% 2.52% -14.31% 27. 59% 51. 30% 43. 92% 7.44% 55. 73% 60. 96% 30.57% 35.40% 6.77% 58. 49% 14.97% 13.46% 22. 82% StockVI Stock -7.62% 65. 83% -16.26% 54.48% -4.81% 16.07% 7.46% 25.33% -3.66% -51.41% -15. 40% 35. 97% 45.36% 18.50% 13.09% -25.01% 16. 30% 83.04% 20.95% -3.48% 13. 14% 18.62% -22.32% 18.68% -9.97% -17. 90% 16. 23% 39.37% 19.78% 2.54% 34.48% 16. 40% Stock8 StockIX 31. 11% -10.35% 8.76% 34.37% 22. 49% -13.07% 39.58% 8.01% 3.45% 76.21% 16. 24% 68.22% 63. 61% -15. 88% -0.29% 28.44% 7. 63% -13.57% 34.17% 23. 85% 7.68% 21. 50% 20.04% 2. 93% 9. 68% 47.51% -38. 98% 35. 83% 13.03% 18. 18% 43.59% 34.56%


