Answered step by step
Verified Expert Solution
Link Copied!

Question

1 Approved Answer

2008 111 Table 4-2. Income Statement and Balance Sheet for Sam's Appliances Income Statement Balance Sheet Years Ending December 31 January 1 through December 31
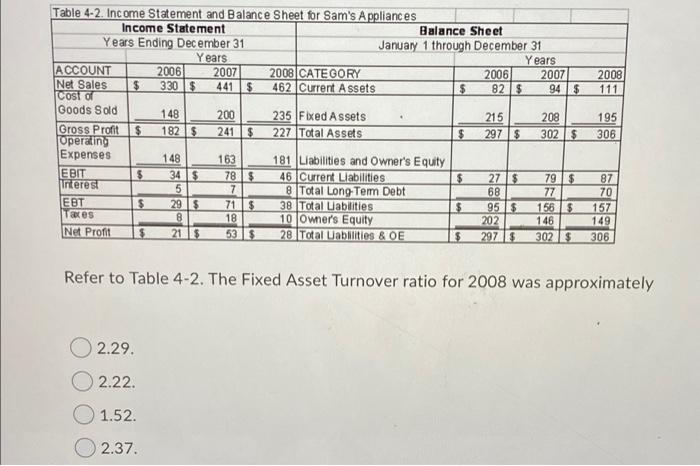
image text in transcribed
2008 111 Table 4-2. Income Statement and Balance Sheet for Sam's Appliances Income Statement Balance Sheet Years Ending December 31 January 1 through December 31 Years Years ACCOUNT 2006 2007 2008 CATEGORY 2006 2007 Net Sales $ 330 $ 441 $ 462 Current Assets $ 82 $ 94 $ Cost of Goods Sold 148 200 235 Fixed Assets 215 208 Gross Profit $ 1825 241$ 227 Total Assets $ 297 $ 302 $ Operating Expenses 148 163 181 Liabilities and Owner's Equity EBIT $ 341$ 78$ 46 Current Liabilities $ 27 $ 79$ Interest 5 7 8 Total Long Tem Debt 68 77 EBT $ 295 715 38 Total Uablities $ 95 $ 156 $ Tares 8 18 10 Owner's Equity 202 146 Net Profit 21 53 28 Total abilities & OE 29715 302 $ 195 306 87 70 157 149 306 Refer to Table 4-2. The Fixed Asset Turnover ratio for 2008 was approximately 2.29. 2.22. 1.52. 2.37

Step by Step Solution

There are 3 Steps involved in it

Step: 1

blur-text-image

Get Instant Access to Expert-Tailored Solutions

See step-by-step solutions with expert insights and AI powered tools for academic success

Step: 2

blur-text-image

Step: 3

blur-text-image

Ace Your Homework with AI

Get the answers you need in no time with our AI-driven, step-by-step assistance

Get Started

Recommended Textbook for

More Books

Students also viewed these Finance questions

Question

What are the factors that influence make or buy decisions ?

Answered: 1 week ago

Question

Define plant location.

Answered: 1 week ago

Question

Define plant location.

Answered: 1 week ago