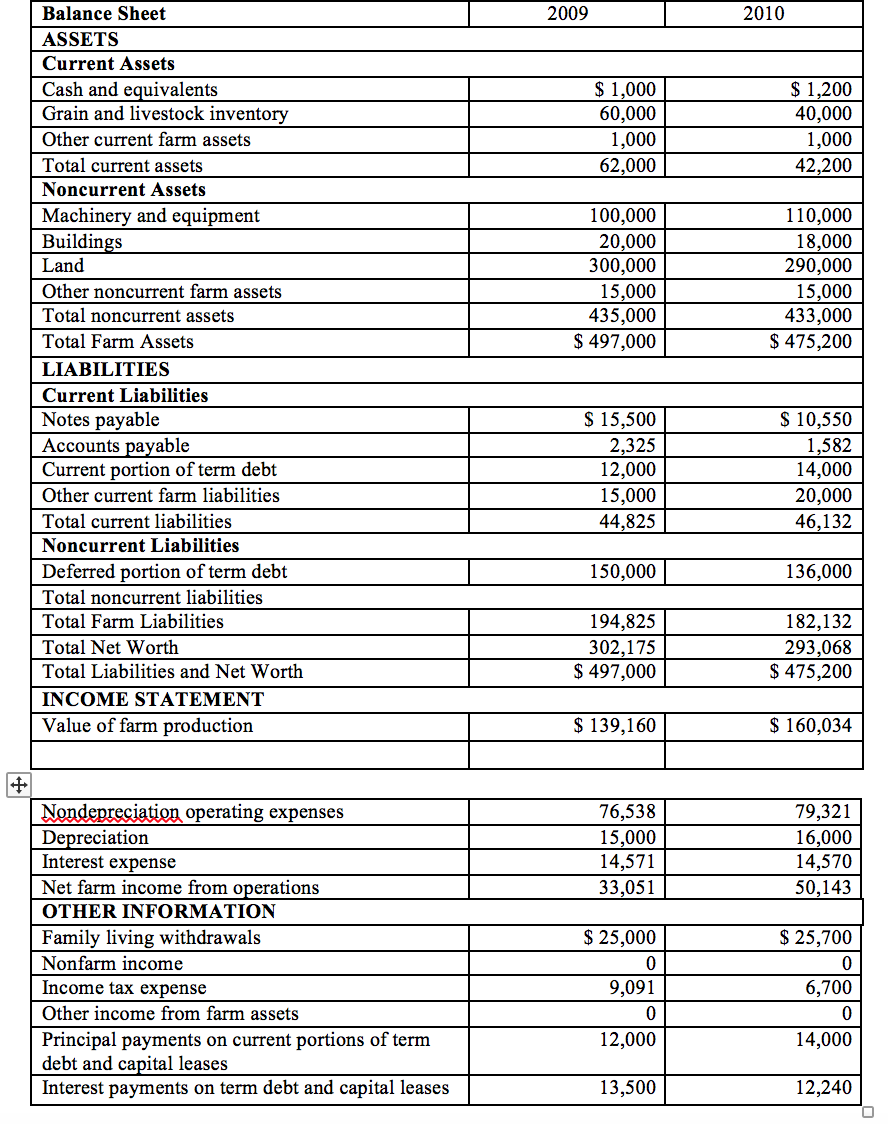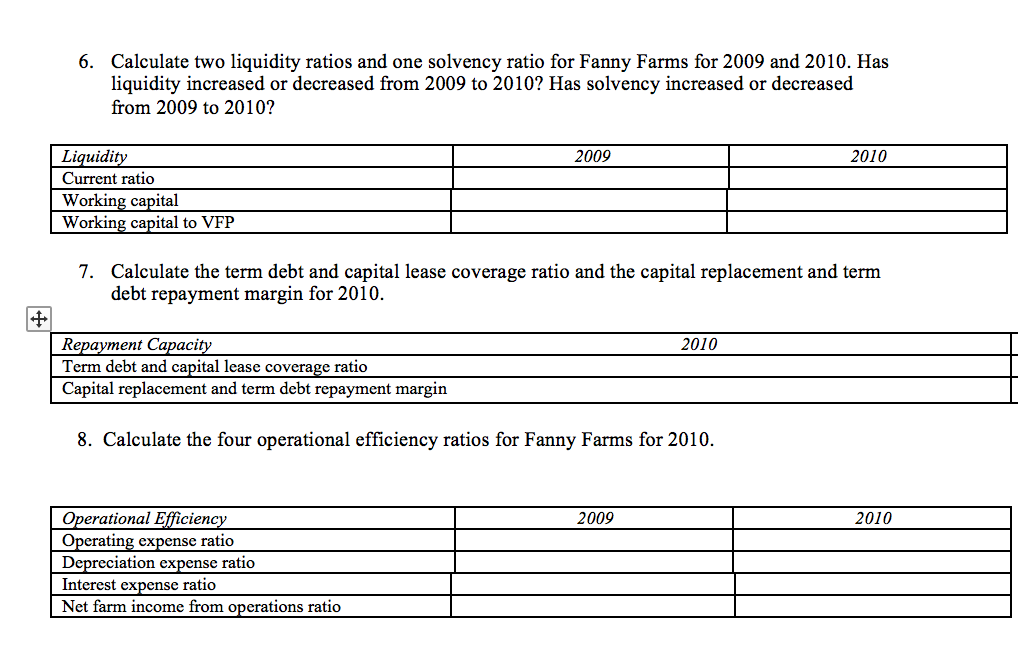

2009 2010 $ 1,000 60,000 1,000 62,000 $ 1,200 40,000 1,000 42,200 100,000 20,000 300,000 15,000 435,000 $ 497,000 110,000 18,000 290,000 15,000 433,000 $ 475,200 Balance Sheet ASSETS Current Assets Cash and equivalents Grain and livestock inventory Other current farm assets Total current assets Noncurrent Assets Machinery and equipment Buildings Land Other noncurrent farm assets Total noncurrent assets Total Farm Assets LIABILITIES Current Liabilities Notes payable Accounts payable Current portion of term debt Other current farm liabilities Total current liabilities Noncurrent Liabilities Deferred portion of term debt Total noncurrent liabilities | Total Farm Liabilities Total Net Worth Total Liabilities and Net Worth INCOME STATEMENT Value of farm production $ 15,500 2,325 12,000 15,000 44,825 $ 10,550 1,582 14,000 20,000 46,132 150,000 136,000 194,825 302,175 $ 497,000 182,132 293,068 $ 475,200 $ 139,160 $ 160,034 $1 76,538 15,000 14,571 33,051 79,321 16,000 14,570 50,143 $ 25,000 $ 25,700 Nondepreciation operating expenses Depreciation Interest expense Net farm income from operations OTHER INFORMATION Family living withdrawals Nonfarm income Income tax expense Other income from farm assets Principal payments on current portions of term debt and capital leases Interest payments on term debt and capital leases 9,091 6,700 0 12,000 14,000 13,500 12,240 6. Calculate two liquidity ratios and one solvency ratio for Fanny Farms for 2009 and 2010. Has liquidity increased or decreased from 2009 to 2010? Has solvency increased or decreased from 2009 to 2010? 2009 2010 Liquidity Current ratio Working capital Working capital to VFP 7. Calculate the term debt and capital lease coverage ratio and the capital replacement and term debt repayment margin for 2010. 2010 Repayment Capacity Term debt and capital lease coverage ratio Capital replacement and term debt repayment margin 8. Calculate the four operational efficiency ratios for Fanny Farms for 2010. 2009 2010 Operational Efficiency Operating expense ratio Depreciation expense ratio Interest expense ratio Net farm income from operations ratio


