

Answered step by step
Verified Expert Solution
Question
1 Approved Answer
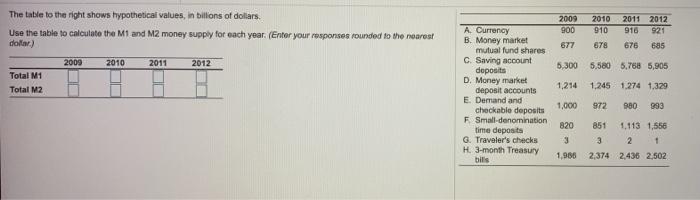
2009 900 2010 910 2011 2012 916 921 676 685 678 The table to the right shows hypothetical values in billions of dollars. Use the
Step by Step Solution
There are 3 Steps involved in it
Step: 1

Get Instant Access to Expert-Tailored Solutions
See step-by-step solutions with expert insights and AI powered tools for academic success
Step: 2

Step: 3
Ace Your Homework with AI
Get the answers you need in no time with our AI-driven, step-by-step assistance
Get Started
Venture Capital Valuation
Authors: Lorenzo Carver
1st Edition
0470908289, 978-0470908280