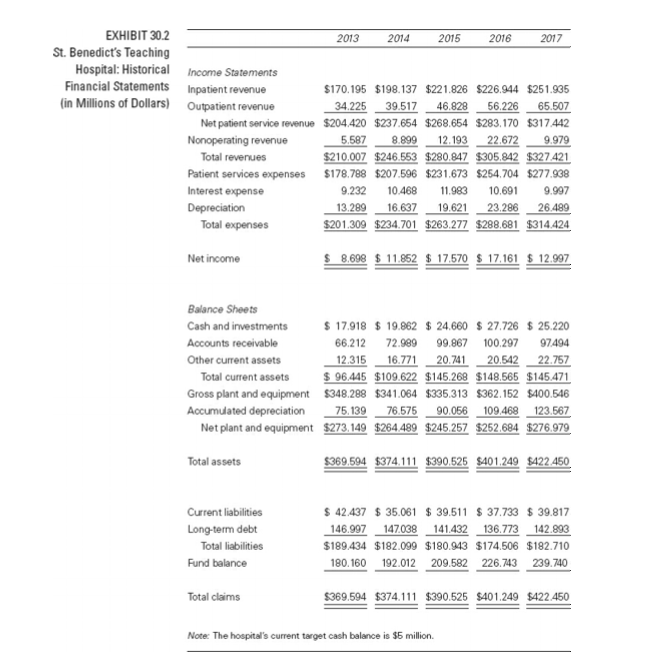
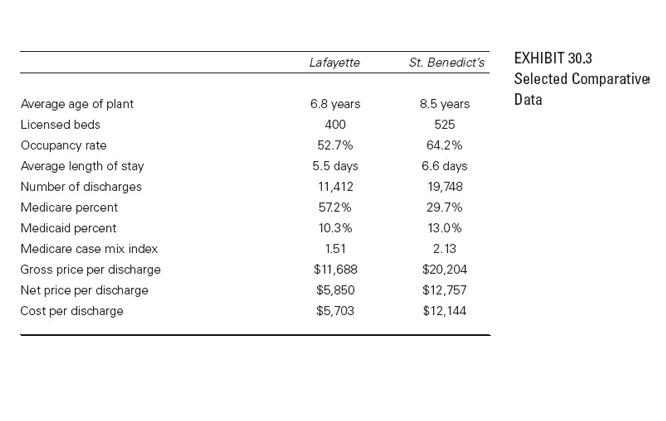
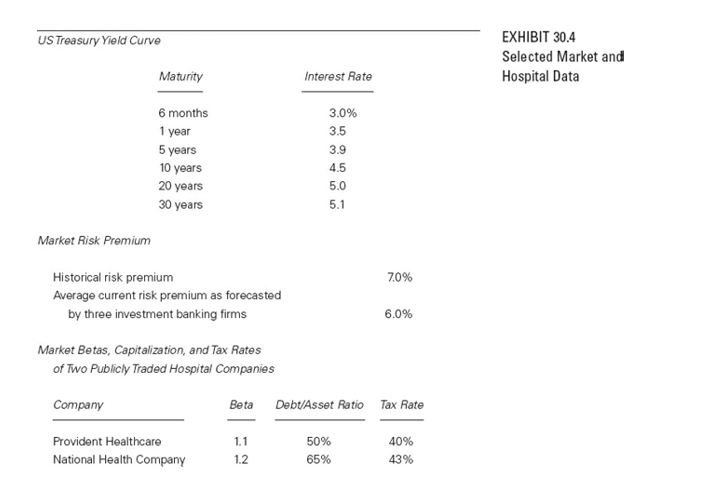
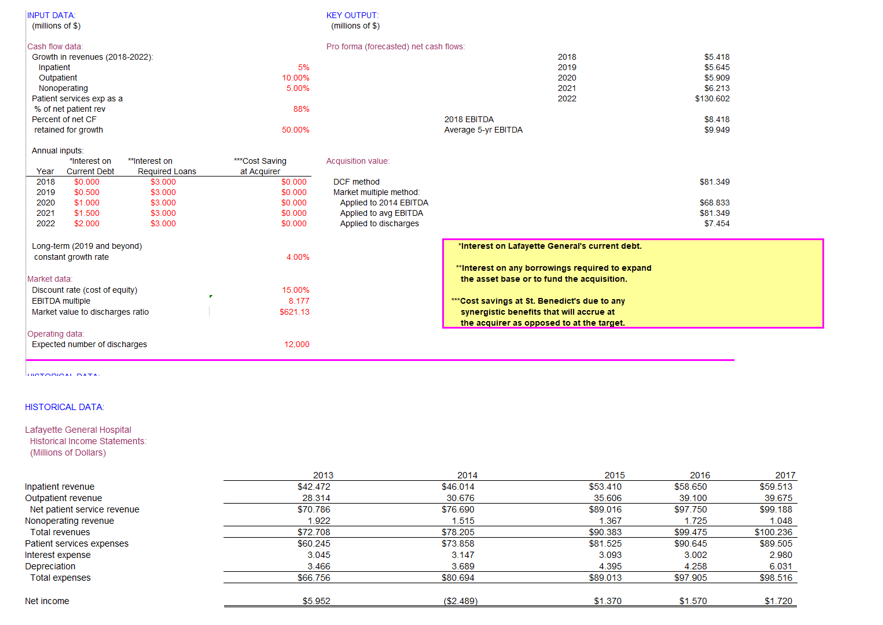
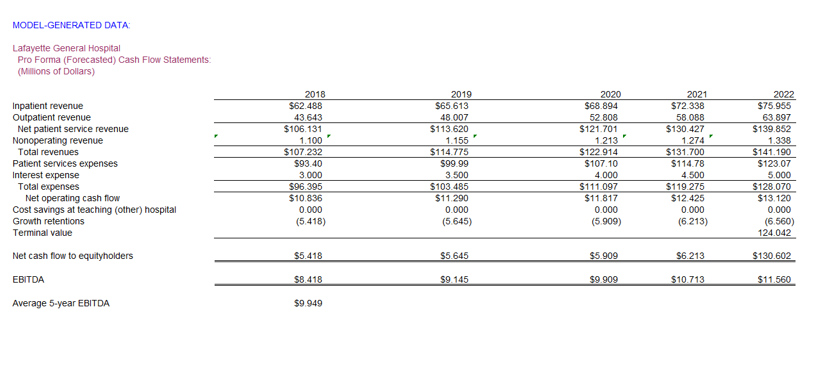
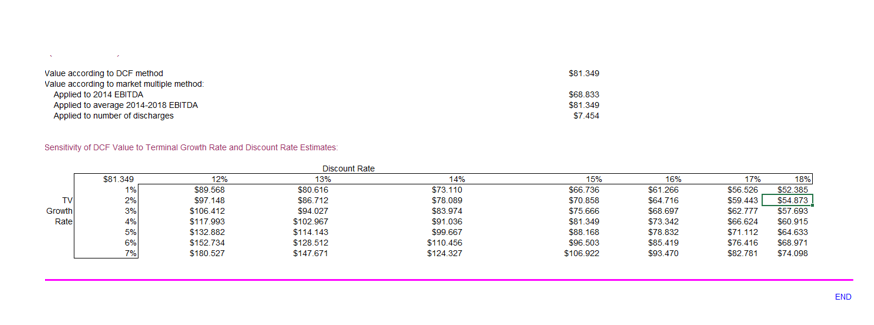
2013 2014 2017 EXHIBIT 30.2 2015 2016 St. Benedict's Teaching Hospital: Historical Income Statements Financial Statements Inpatient revenue $170.195 $198.137 $221.826 $226.944 $251.935 (in Millions of Dollars) Outpatient revenue 34.225 39.517 46.828 56.226 65.507 Net patient service revenue $204,420 $237.654 $268.654 $283.170 $317.442 Nonoperating revenue 5.587 8.899 12.193 22.672 9.979 Total revenues $210.007 $246.553 $280.847 $305.842 $327.421 Patient services expenses $178.788 $207.596 $231.673 $254.704 $277.908 Interest expense 9.232 10.468 11.983 10.691 9.997 Depreciation 13.289 16.637 19.621 23.286 26.489 Total expenses $201.309 $234.701 $263.277 $288.681 $314.424 Net income $ 8.698 $ 11.852 $ 17.570 $ 17,161 $ 12.997 Balance Sheets Cash and investments $ 17.918 $ 19.862 $ 24.660 $ 27.726 $ 25.220 Accounts receivable 66.212 72.989 99.867 100.297 97.494 Other current assets 12.315 16.771 20.741 20.542 22.757 Total current assets $ 96.445 $109.622 $145.268 $148.565 $145.471 Gross plant and equipment $348.288 $341.064 $335.313 $362.152 $400.546 Accumulated depreciation 75.139 76.575 90.056 109.468 123.567 Net plant and equipment $273.149 $264,489 $245.257 $262.684 $276.979 Total assets $369.594 $374.111 $390.525 $401.249 $422.450 Current liabilities Long-term debt Total liabilities Fund balance $ 42.437 $ 35.061 $ 39.511 $ 37.733 $ 39.817 146.997 147.038 141432 136.773 142.893 $189.434 $182.099 $180.943 $174.506 $182.710 180.160 192.012 209.582 226.743 239.740 Total claims $369.594 $374.111 $390.525 5401.249 $422.450 Note: The hospital's current target cash balance is $5 million. Lafayette St. Benedict's EXHIBIT 30.3 Selected Comparative Data Average age of plant Licensed beds Occupancy rate Average length of stay Number of discharges Medicare percent Medicaid percent Medicare case mix index Gross price per discharge Net price per discharge Cost per discharge 6.8 years 400 52.7% 5.5 days 11,412 57.2% 10.3% 1.51 $11,688 $5,850 $5,703 8.5 years 525 64.2% 6.6 days 19,748 29.7% 13.0% 2.13 $20,204 $12,757 $12,144 Question 7 Assume that Hospital Associates of America (HAA) conducted a valuation of Lafayette General Hospital a. Would HAA place a higher, lower, or about the same value on Lafayette General than would St. Benedict's? Justify your answer. b. Would the degree of interest exhibited by HAA in acquiring Lafayette General influence the | amount of St. Benedict's initial offer? Question 8 How much external financing would St. Benedict's have to arrange to pay for the acquisition? (Hint: Consider the amount of excess cash on hand first. See exhibit 30.4 for guidance.) What types of securities and maturity structure should be specified in the financing plan? US Treasury Yield Curvo EXHIBIT 30.4 Selected Market and Hospital Data Maturity Interest Rate 6 months 1 year 5 years 10 years 20 years 30 years 3.0% 3.5 3.9 4.5 5.0 5.1 Market Risk Premium 70% Historical risk premium Average current risk premium as forecasted by three investment banking firms 6.0% Market Betas, Capitalization, and Tax Rates of Two Publicly Traded Hospital Companies Company Beta Debt/Asset Ratio Tax Rate Provident Healthcare National Health Company 1.1 1.2 50% 65% 40% 43% MODEL-GENERATED DATA: Lafayette General Hospital Pro Forma (Forecasted) Cash Flow Statements (Millions of Dollars) Inpatient revenue Outpatient revenue Net patient service revenue Nonoperating revenue Total revenues Patient services expenses Interest expense Total expenses Net operating cash flow Cost savings at teaching (other) hospital Growth retentions Terminal value 2018 $62.488 43.643 $106.131 1.100 $107.232 $93.40 3.000 $96.395 $10.836 0.000 (5.418) 2019 $65.613 48.007 $113.620 1.155 $114.775 $99.99 3.500 $103.485 $11.290 0.000 (5.645) 2020 $68.894 52.808 $121.701 1.213 $122.914 $107.10 4.000 $111.097 $11.817 0.000 (5.909) 2021 $72.338 58.088 $130.427 1.274 $131.700 $114.78 4.500 $119.275 $12.425 0.000 (6213) 2022 $75.955 63.897 $139.852 1.338 $141.190 $123.07 5.000 $128.070 $13.120 0.000 (6.560) 124.042 $5.418 $5.645 $5.909 $6.213 $130.602 Net cash flow to equityholders EBITDA $8.418 $9 145 $9.909 $10 713 $11.560 Average 5.year EBITDA $9.949 $81 349 Value according to DCF method Value according to market multiple method Applied to 2014 EBITDA Applied to average 2014-2018 EBITDA Applied to number of discharges $68 833 $81.340 $7.454 Sensitivity of DCF value to Terminal Growth Rate and Discount Rate Estimates: Discount Rate $81.349 12% 13% 1% $89.568 $80.616 TV 2% $97.148 $86.712 Growth 3% $106.412 $94.027 Rate $117 993 $102 967 5% $132.882 $114.143 6% $152.734 $128.512 79 $180 527 $147 671 14% $73.110 $78 089 $83.974 $91.036 $99.667 $110.456 $124 327 15% $66.736 $70 858 $75,666 $81.349 $88.168 $96.503 $106 922 16% $61 266 $64.716 $68.697 $73.342 $78,832 $85.419 $93.470 17% $56.526 $59 443 S62.777 $66.624 $71.112 $76.416 $82.781 18% $52.385 $54873 $57693 $60 915 $64.633 $68.971 $74.098 END 2013 2014 2017 EXHIBIT 30.2 2015 2016 St. Benedict's Teaching Hospital: Historical Income Statements Financial Statements Inpatient revenue $170.195 $198.137 $221.826 $226.944 $251.935 (in Millions of Dollars) Outpatient revenue 34.225 39.517 46.828 56.226 65.507 Net patient service revenue $204,420 $237.654 $268.654 $283.170 $317.442 Nonoperating revenue 5.587 8.899 12.193 22.672 9.979 Total revenues $210.007 $246.553 $280.847 $305.842 $327.421 Patient services expenses $178.788 $207.596 $231.673 $254.704 $277.908 Interest expense 9.232 10.468 11.983 10.691 9.997 Depreciation 13.289 16.637 19.621 23.286 26.489 Total expenses $201.309 $234.701 $263.277 $288.681 $314.424 Net income $ 8.698 $ 11.852 $ 17.570 $ 17,161 $ 12.997 Balance Sheets Cash and investments $ 17.918 $ 19.862 $ 24.660 $ 27.726 $ 25.220 Accounts receivable 66.212 72.989 99.867 100.297 97.494 Other current assets 12.315 16.771 20.741 20.542 22.757 Total current assets $ 96.445 $109.622 $145.268 $148.565 $145.471 Gross plant and equipment $348.288 $341.064 $335.313 $362.152 $400.546 Accumulated depreciation 75.139 76.575 90.056 109.468 123.567 Net plant and equipment $273.149 $264,489 $245.257 $262.684 $276.979 Total assets $369.594 $374.111 $390.525 $401.249 $422.450 Current liabilities Long-term debt Total liabilities Fund balance $ 42.437 $ 35.061 $ 39.511 $ 37.733 $ 39.817 146.997 147.038 141432 136.773 142.893 $189.434 $182.099 $180.943 $174.506 $182.710 180.160 192.012 209.582 226.743 239.740 Total claims $369.594 $374.111 $390.525 5401.249 $422.450 Note: The hospital's current target cash balance is $5 million. Lafayette St. Benedict's EXHIBIT 30.3 Selected Comparative Data Average age of plant Licensed beds Occupancy rate Average length of stay Number of discharges Medicare percent Medicaid percent Medicare case mix index Gross price per discharge Net price per discharge Cost per discharge 6.8 years 400 52.7% 5.5 days 11,412 57.2% 10.3% 1.51 $11,688 $5,850 $5,703 8.5 years 525 64.2% 6.6 days 19,748 29.7% 13.0% 2.13 $20,204 $12,757 $12,144 Question 7 Assume that Hospital Associates of America (HAA) conducted a valuation of Lafayette General Hospital a. Would HAA place a higher, lower, or about the same value on Lafayette General than would St. Benedict's? Justify your answer. b. Would the degree of interest exhibited by HAA in acquiring Lafayette General influence the | amount of St. Benedict's initial offer? Question 8 How much external financing would St. Benedict's have to arrange to pay for the acquisition? (Hint: Consider the amount of excess cash on hand first. See exhibit 30.4 for guidance.) What types of securities and maturity structure should be specified in the financing plan? US Treasury Yield Curvo EXHIBIT 30.4 Selected Market and Hospital Data Maturity Interest Rate 6 months 1 year 5 years 10 years 20 years 30 years 3.0% 3.5 3.9 4.5 5.0 5.1 Market Risk Premium 70% Historical risk premium Average current risk premium as forecasted by three investment banking firms 6.0% Market Betas, Capitalization, and Tax Rates of Two Publicly Traded Hospital Companies Company Beta Debt/Asset Ratio Tax Rate Provident Healthcare National Health Company 1.1 1.2 50% 65% 40% 43% MODEL-GENERATED DATA: Lafayette General Hospital Pro Forma (Forecasted) Cash Flow Statements (Millions of Dollars) Inpatient revenue Outpatient revenue Net patient service revenue Nonoperating revenue Total revenues Patient services expenses Interest expense Total expenses Net operating cash flow Cost savings at teaching (other) hospital Growth retentions Terminal value 2018 $62.488 43.643 $106.131 1.100 $107.232 $93.40 3.000 $96.395 $10.836 0.000 (5.418) 2019 $65.613 48.007 $113.620 1.155 $114.775 $99.99 3.500 $103.485 $11.290 0.000 (5.645) 2020 $68.894 52.808 $121.701 1.213 $122.914 $107.10 4.000 $111.097 $11.817 0.000 (5.909) 2021 $72.338 58.088 $130.427 1.274 $131.700 $114.78 4.500 $119.275 $12.425 0.000 (6213) 2022 $75.955 63.897 $139.852 1.338 $141.190 $123.07 5.000 $128.070 $13.120 0.000 (6.560) 124.042 $5.418 $5.645 $5.909 $6.213 $130.602 Net cash flow to equityholders EBITDA $8.418 $9 145 $9.909 $10 713 $11.560 Average 5.year EBITDA $9.949 $81 349 Value according to DCF method Value according to market multiple method Applied to 2014 EBITDA Applied to average 2014-2018 EBITDA Applied to number of discharges $68 833 $81.340 $7.454 Sensitivity of DCF value to Terminal Growth Rate and Discount Rate Estimates: Discount Rate $81.349 12% 13% 1% $89.568 $80.616 TV 2% $97.148 $86.712 Growth 3% $106.412 $94.027 Rate $117 993 $102 967 5% $132.882 $114.143 6% $152.734 $128.512 79 $180 527 $147 671 14% $73.110 $78 089 $83.974 $91.036 $99.667 $110.456 $124 327 15% $66.736 $70 858 $75,666 $81.349 $88.168 $96.503 $106 922 16% $61 266 $64.716 $68.697 $73.342 $78,832 $85.419 $93.470 17% $56.526 $59 443 S62.777 $66.624 $71.112 $76.416 $82.781 18% $52.385 $54873 $57693 $60 915 $64.633 $68.971 $74.098 END