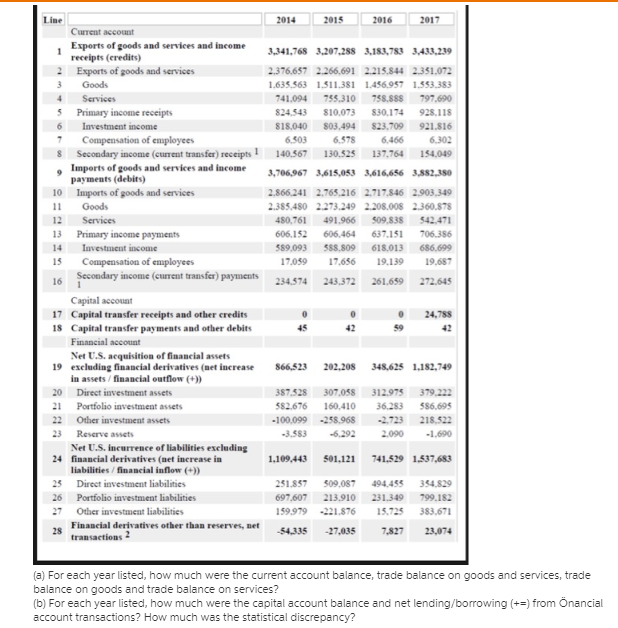
2014 2015 2016 2017 2 3 5 6 7 8 Current account Exports of goods and services and income receipts (eredits) Exports of goods and services Goods Services Primary income receipts Investment income Compensation of employees Secondary income (current transfer) receipts1 Imports of goods and services and income payments (debits) Imports of goods and services Goods Services Primary income payments Investment income Compensation of employees Secondary income (current transfer payments i 3,341,768 3.207.288 3.183,783 3,433,239 2.376.657 2.266,691 2.215.844 2.351.072 1.635.363 1.511.381 1.456.957 1.553.383 741.094 755.310 758.888 797,690 824.543 810.073830.174 928.118 818.040 803.494 $23.709 921.816 6,5036 ,578 6.466 6.302 140.567 130.525 137,764 154,049 3,706,967 3.615,053 3,616,656 3,882,350 10 11 12 13 14 15 2.866.241 2.385.480 480,761 606.152 589.093 17.059 2.765 216 2.273.249 491.966 606.464 588.809 17.656 2.717.846 2.903.349 2.208.008 2.360.878 509.838 542.471 637.151706.386 618.013 686,699 19.13919.687 16 234.574 243.372 261.659 272.645 0 24.788 866,523 202,208 348.625 1.182,749 Capital account 17 Capital transfer receipts and other credits 18 Capital transfer payments and other debits Financial account Net U.S. acquisition of financial assets 19 excluding financial derivatives (net increase in assets/financial outflow (+)) 20 Direct investment assets 21 Portfolio investment assets 22 Other investment assets 23 Reserve assets Net U.S. incurrence of liabilities excluding 24 financial derivatives (net increase in liabilities/financial inflow()) 25 Direct investment liabilities 26 Portfolio investment liabilities 27 Other investment liabilities de Financial derivatives other than reserves, bet transactions 2 387,528 582.676 -100.099 -3.583 307,058 160.410 -258.968 -6.292 312.975 36.283 -2.723 2.090 379.222 586.695 218,522 -1.690 1.109.443 501,121 741.529 1.537,683 251.857 697.607 159.979 -54.335 309.087 213.910 221.876 27,035 494.455354.829 231.349 799.182 15.725 383.671 7.827 23,074 (a) For each year listed, how much were the current account balance, trade balance on goods and services, trade balance on goods and trade balance on services? (b) For each year listed, how much were the capital account balance and net lending/borrowing (+=) from nancial account transactions? How much was the statistical discrepancy


