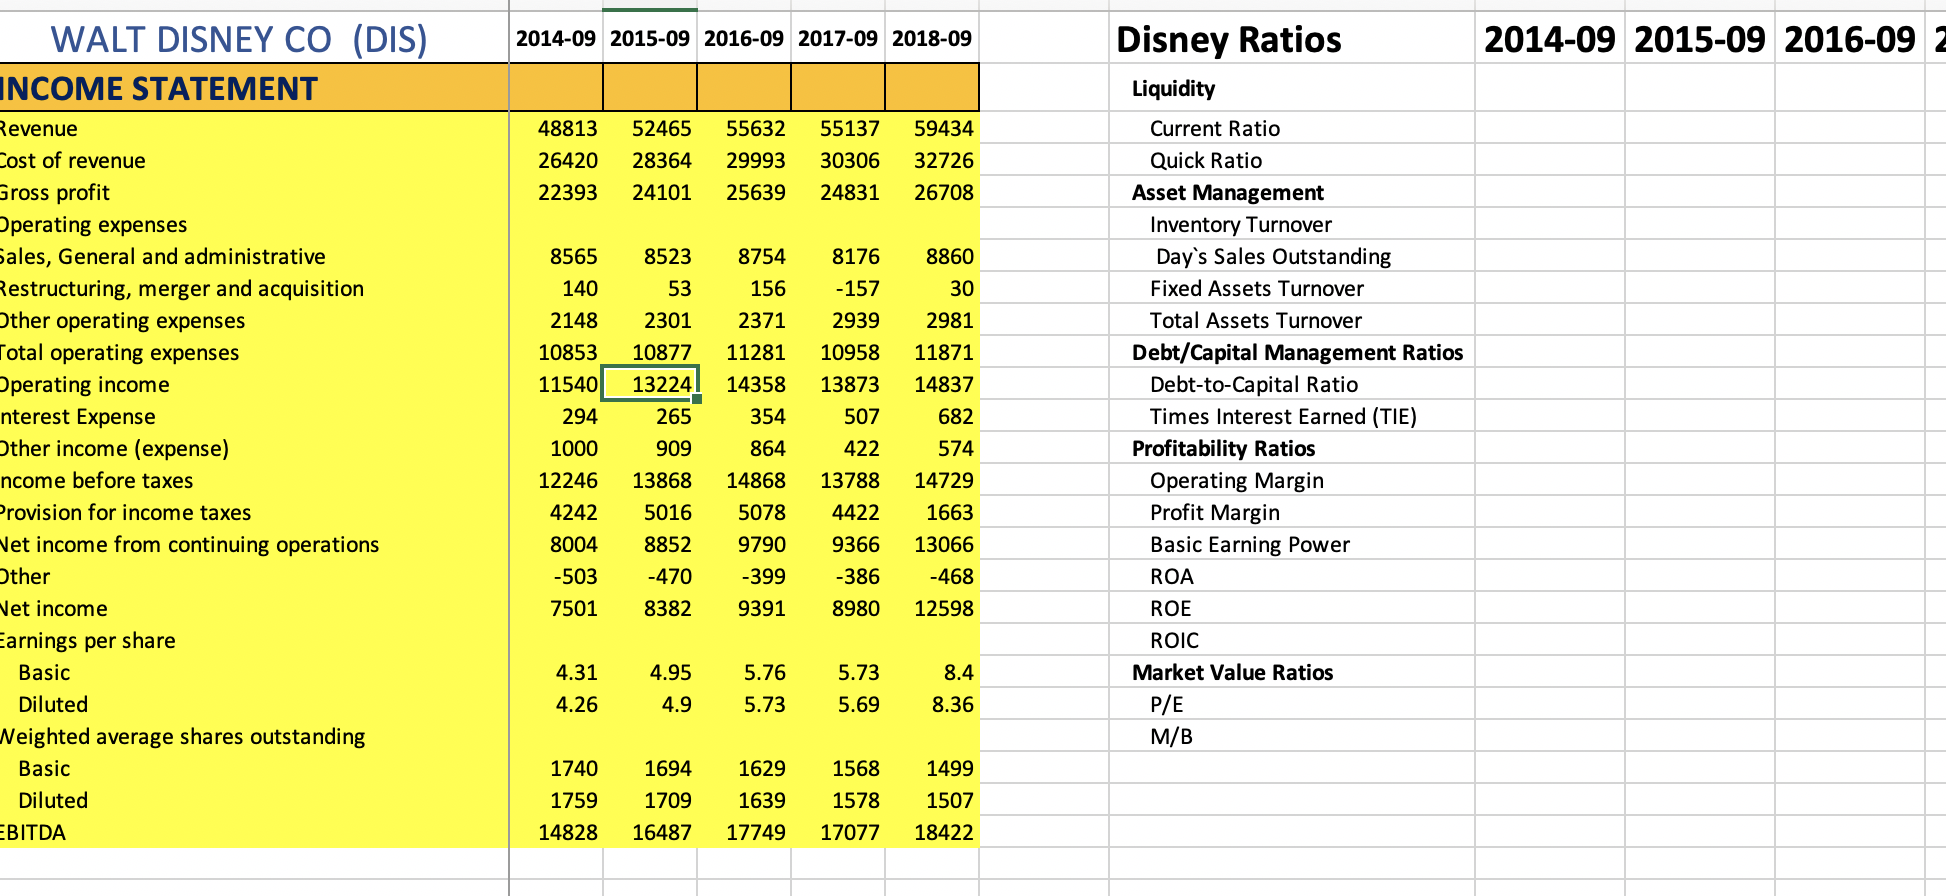
2014-09 2015-09 2016-09 2017-09 2018-09 2014-09 2015-09 2016-09 2 48813 26420 22393 52465 28364 24101 55632 29993 25639 55137 30306 24831 59434 32726 26708 8565 8176 140 WALT DISNEY CO (DIS) INCOME STATEMENT Revenue Cost of revenue Gross profit Operating expenses Sales, General and administrative Restructuring, merger and acquisition Other operating expenses Total operating expenses Operating income nterest Expense Other income (expense) ncome before taxes Provision for income taxes Vet income from continuing operations Other Net income Earnings per share Basic Diluted Neighted average shares outstanding Basic Diluted EBITDA 2148 10853 11540 294 1000 12246 4242 8004 -503 7501 8523 53 2301 10877 13224 265 909 13868 8754 156 2371 11281 14358 354 864 14868 5078 9790 -399 9391 -157 2939 10958 13873 507 422 13788 4422 9366 -386 8980 8860 30 2981 11871 14837 682 574 14729 1663 13066 Disney Ratios Liquidity Current Ratio Quick Ratio Asset Management Inventory Turnover Day's Sales Outstanding Fixed Assets Turnover Total Assets Turnover Debt/Capital Management Ratios Debt-to-Capital Ratio Times Interest Earned (TIE) Profitability Ratios Operating Margin Profit Margin Basic Earning Power ROA ROE ROIC Market Value Ratios P/E M/B 5016 8852 -470 8382 -468 12598 4.95 5.76 4.31 4.26 5.73 5.69 8.4 8.36 4.9 5.73 1740 1694 1709 1759 1629 1639 17749 1568 1578 17077 1499 1507 18422 14828 16487 2014-09 2015-09 2016-09 2017-09 2018-09 2014-09 2015-09 2016-09 2 48813 26420 22393 52465 28364 24101 55632 29993 25639 55137 30306 24831 59434 32726 26708 8565 8176 140 WALT DISNEY CO (DIS) INCOME STATEMENT Revenue Cost of revenue Gross profit Operating expenses Sales, General and administrative Restructuring, merger and acquisition Other operating expenses Total operating expenses Operating income nterest Expense Other income (expense) ncome before taxes Provision for income taxes Vet income from continuing operations Other Net income Earnings per share Basic Diluted Neighted average shares outstanding Basic Diluted EBITDA 2148 10853 11540 294 1000 12246 4242 8004 -503 7501 8523 53 2301 10877 13224 265 909 13868 8754 156 2371 11281 14358 354 864 14868 5078 9790 -399 9391 -157 2939 10958 13873 507 422 13788 4422 9366 -386 8980 8860 30 2981 11871 14837 682 574 14729 1663 13066 Disney Ratios Liquidity Current Ratio Quick Ratio Asset Management Inventory Turnover Day's Sales Outstanding Fixed Assets Turnover Total Assets Turnover Debt/Capital Management Ratios Debt-to-Capital Ratio Times Interest Earned (TIE) Profitability Ratios Operating Margin Profit Margin Basic Earning Power ROA ROE ROIC Market Value Ratios P/E M/B 5016 8852 -470 8382 -468 12598 4.95 5.76 4.31 4.26 5.73 5.69 8.4 8.36 4.9 5.73 1740 1694 1709 1759 1629 1639 17749 1568 1578 17077 1499 1507 18422 14828 16487