

Answered step by step
Verified Expert Solution
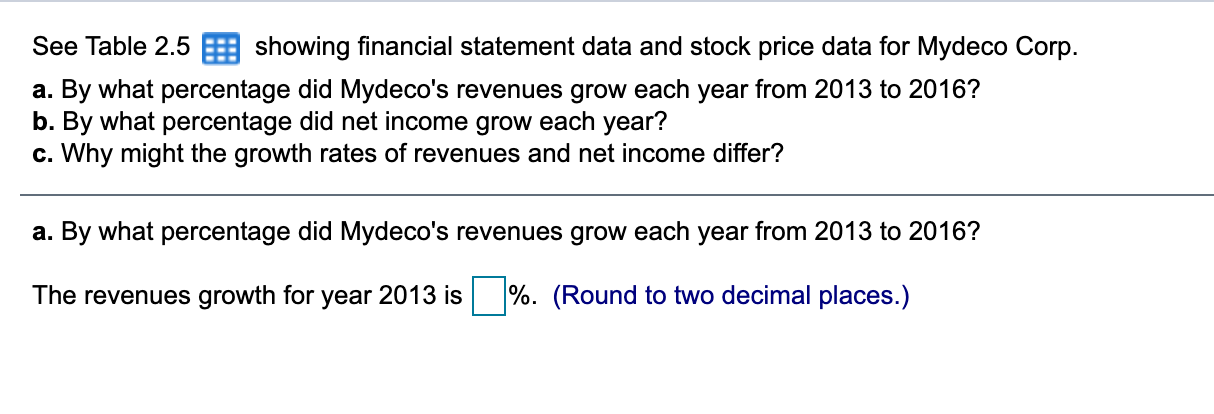
Question
1 Approved Answer
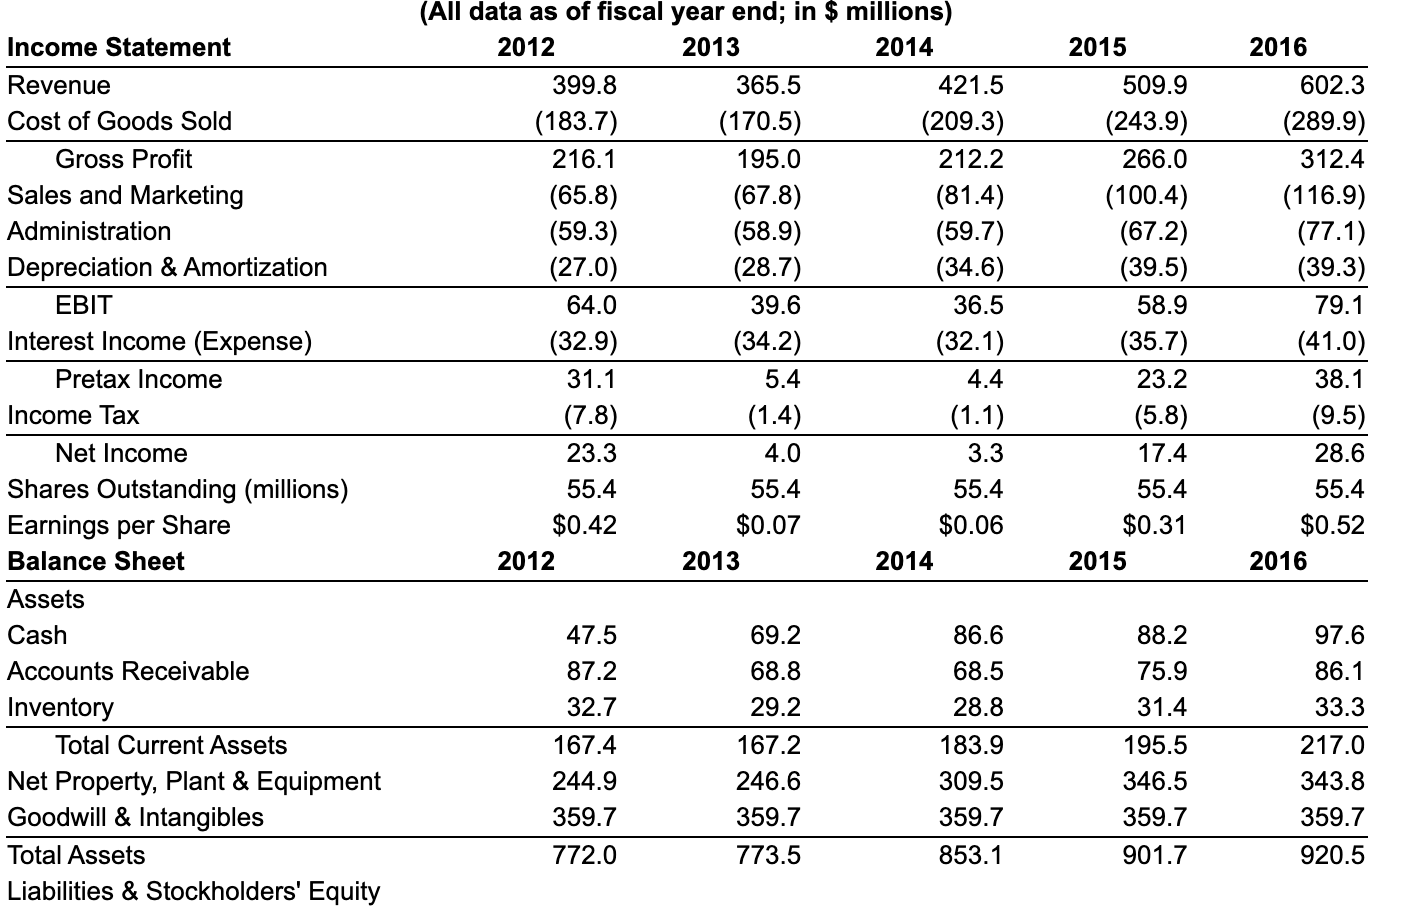
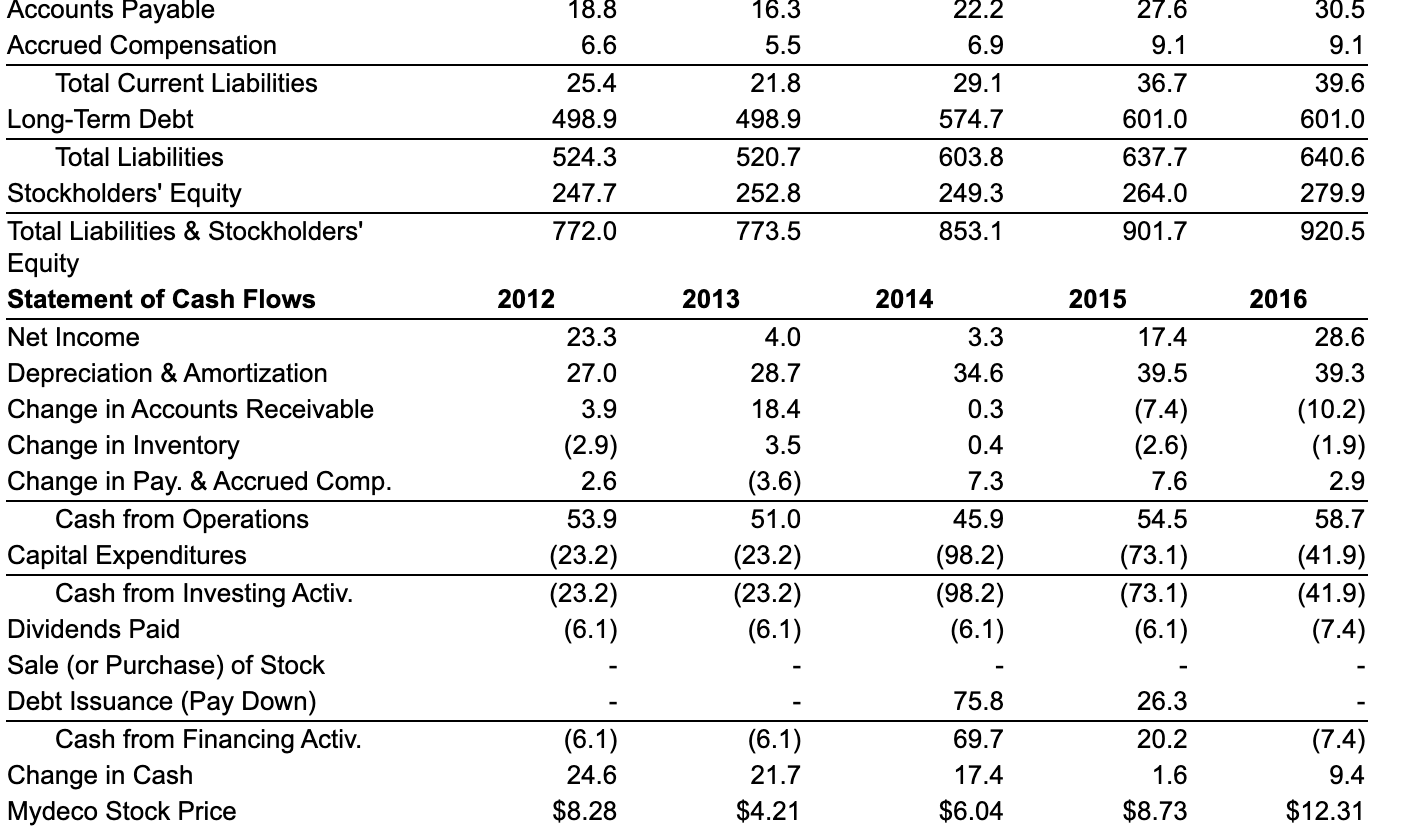
2015 Income Statement Revenue Cost of Goods Sold Gross Profit Sales and Marketing Administration Depreciation & Amortization EBIT Interest Income (Expense) Pretax Income Income Tax
Step by Step Solution
There are 3 Steps involved in it
Step: 1

Get Instant Access to Expert-Tailored Solutions
See step-by-step solutions with expert insights and AI powered tools for academic success
Step: 2

Step: 3
Ace Your Homework with AI
Get the answers you need in no time with our AI-driven, step-by-step assistance
Get Started
A Guide To Starting Your Hedge Fund
Authors: John Thompson, Erik Serrano Berntsen
1st Edition
0470519401, 978-0470519400