

Answered step by step
Verified Expert Solution
Question
1 Approved Answer
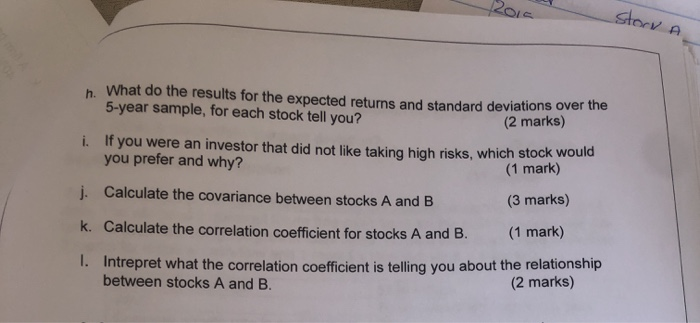
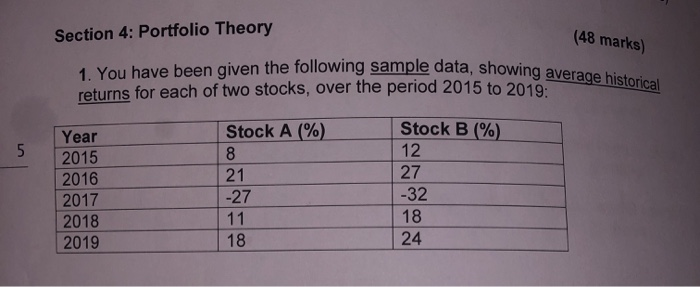
2015 story a h. What do the results for the expected returns and standard deviations over the 5-year sample, for each stock tell you? (2
Step by Step Solution
There are 3 Steps involved in it
Step: 1

Get Instant Access to Expert-Tailored Solutions
See step-by-step solutions with expert insights and AI powered tools for academic success
Step: 2

Step: 3
Ace Your Homework with AI
Get the answers you need in no time with our AI-driven, step-by-step assistance
Get Started
Bitcoin Cash What You Need To Know About Bch
Authors: Alexander O. M.
1st Edition
1976721229, 978-1976721229