

Answered step by step
Verified Expert Solution
Question
1 Approved Answer
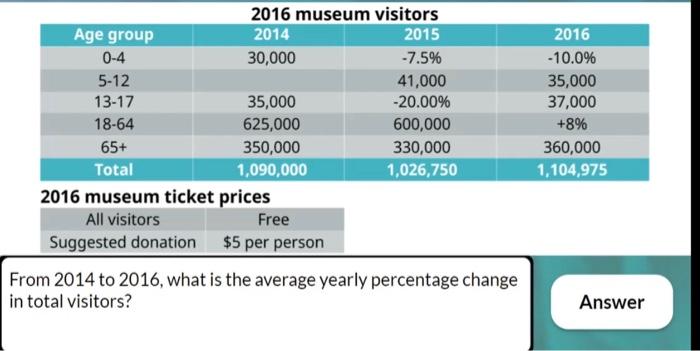
2016 museum visitors Age group 2014 2015 0-4 30,000 -7.5% 5-12 41,000 13-17 35,000 -20.00% 18-64 625,000 600,000 65+ 350,000 330,000 Total 1,090,000 1,026,750 2016
Step by Step Solution
There are 3 Steps involved in it
Step: 1

Get Instant Access to Expert-Tailored Solutions
See step-by-step solutions with expert insights and AI powered tools for academic success
Step: 2

Step: 3
Ace Your Homework with AI
Get the answers you need in no time with our AI-driven, step-by-step assistance
Get Started
Derivatives Markets
Authors: Robert McDonald
3rd Edition
978-9332536746, 9789332536746