

Answered step by step
Verified Expert Solution
Question
1 Approved Answer
2017 2016 1.200 0.990 0.237 21.130 1.169 0.963 2018 1.140 0.937 0.356 20.069 0.288 20.570 60.00% 1.63% 60.00% 163% 0.82% 2.63% 60.00% 1.63% 0.82% 2.69%
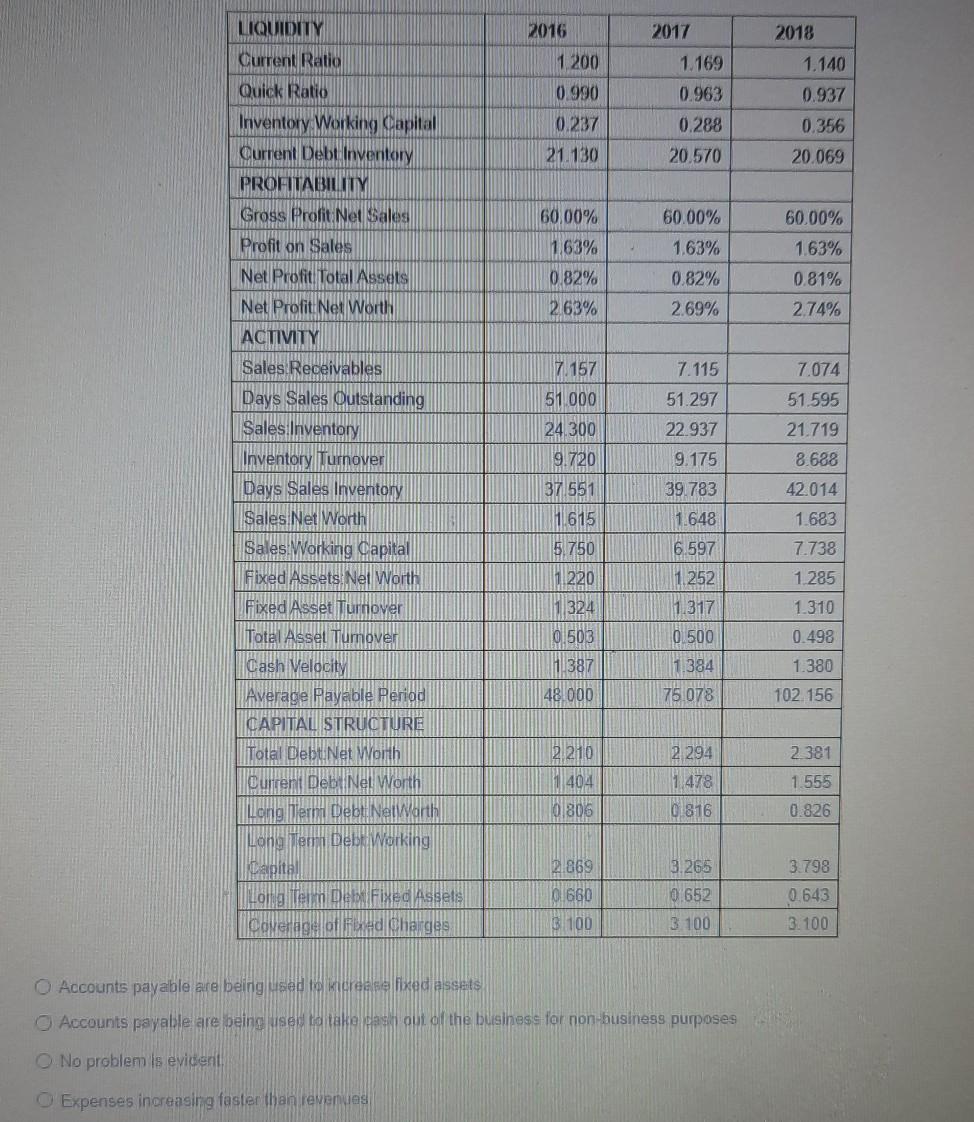
2017 2016 1.200 0.990 0.237 21.130 1.169 0.963 2018 1.140 0.937 0.356 20.069 0.288 20.570 60.00% 1.63% 60.00% 163% 0.82% 2.63% 60.00% 1.63% 0.82% 2.69% 0.81% 2.74% 7.115 7.074 51.595 51.297 22.937 21.719 8.688 LIQUIDITY Current Ratio Quick Ratio Inventory Working Capital Current Debt Inventory PROFITABILITY Gross Profit Net Sales Profit on Sales Net Profit Total Assets Net Profit Net Worth ACTIVITY Sales Receivables Days Sales Outstanding Sales Inventory Inventory Turnover Days Sales Inventory Sales Net Worth Sales Working Capital Fixed Assets. Net Worth Fixed Asset Turnover Total Assel Tumover Cash Velocity Average Payable Period CAPITAL STRUCTURE Total Debt.Net Worth Current Debt Net Worth Long Term Debt NetWorth Long Term Debt Working Capital Long Term De Fixed Assets Coverage of bed charges 42.014 1.683 7.157 51.000 24.300 9.720 37 551 1615 5.750 1 220 1324 0.503 1387 48.000 7.738 9.175 39.783 1.648 6.597 1.252 1.317 0.500 1.384 75 078 1.285 1.310 0.498 1.380 102 156 2 381 2210 1404 0 806 2.294 1.478 0 816 1.555 0.826 3.798 2.869 0660 3 100 3.265 0.652 3 100 0.643 3.100 Accounts payable are being used to crease fixed assets Accounts payable are being used to take out of the business for non-business purposes No problem is evident Expenses increasing faster than revenues
Step by Step Solution
There are 3 Steps involved in it
Step: 1

Get Instant Access to Expert-Tailored Solutions
See step-by-step solutions with expert insights and AI powered tools for academic success
Step: 2

Step: 3
Ace Your Homework with AI
Get the answers you need in no time with our AI-driven, step-by-step assistance
Get Started
The Ultimate Guide To Rental Property Investing
Authors: John Malatesta
1st Edition
979-8394902215