Answered step by step
Verified Expert Solution
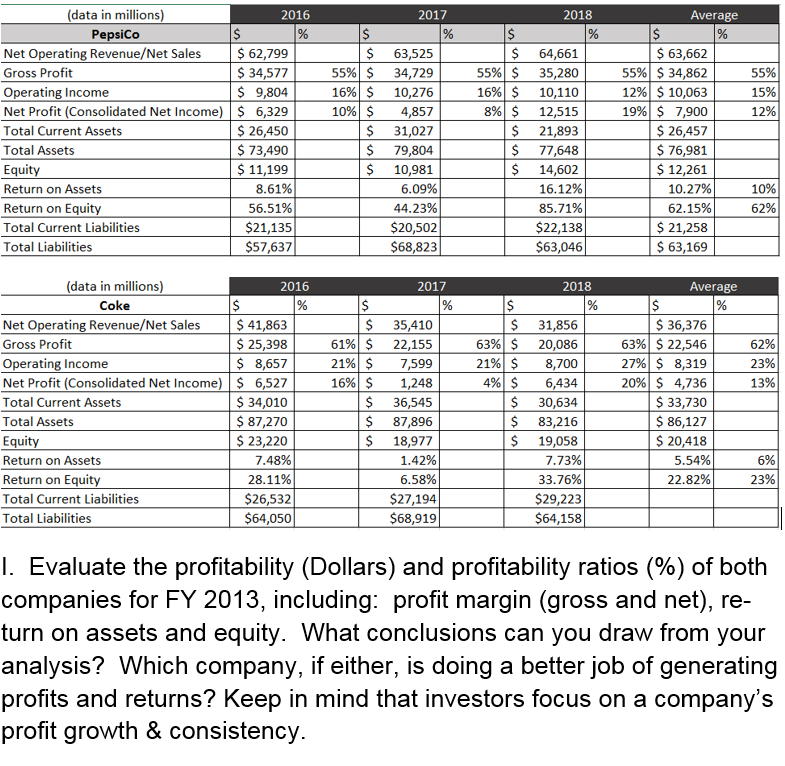
Link Copied!

Question

1 Approved Answer

2017 2018 Average 1% $ $ 55% $ 16% $ 10% $ $ $ $ 55% 16% 8% (data in millions) 2016 PepsiCo $ Net

image text in transcribed

2017 2018 Average 1% $ $ 55% $ 16% $ 10% $ $ $ $ 55% 16% 8% (data in millions) 2016 PepsiCo $ Net Operating Revenue/Net Sales $ 62,799 Gross Profit $ 34,577 Operating Income $ 9,804 Net Profit (Consolidated Net Income) $ 6,329 Total Current Assets $ 26,450 Total Assets $ 73,490 Equity $ 11,199 Return on Assets 8.61% Return on Equity 56.51% Total Current Liabilities $21,135 Total Liabilities $57,637 55% 12% 19% $ $ $ $ $ $ $ $ 55% 15% 12% 63,525 34,729 10,276 4,857 31,027 79,804 10,981 6.09% 44.23% $20,502 $68,823 64,661 35,280 10,110 12,515 21,893 77,648 14,602 16.12% 85.71% $22,138 $63,046 $ 63,662 $ 34,862 $ 10,063 $ 7,900 $ 26,457 $ 76,981 $ 12,261 10.27% 62.15% $ 21,258 $ 63,169 10% 62% 2017 2018 % (data in millions) 2016 Coke $ Net Operating Revenue/Net Sales $ 41,863 Gross Profit $ 25,398 Operating Income $ 8,657 Net Profit (Consolidated Net Income) $ 6,527 Total Current Assets $ 34,010 Total Assets $ 87,270 Equity $ 23,220 Return on Assets 7.48% Return on Equity 28.11% Total Current Liabilities $26,532 Total Liabilities $64,050 $ 61% $ 21% $ 16% $ $ $ $ 35,410 22,155 7,599 1,248 36,545 87,896 18,977 1.42% 6.58% $27,194 $68,9191 $ 63% $ 21% $ 4% $ $ $ $ 62% 23% 13% 31,856 20,086 8,700 6,434 30,634 83,216 19,058 7.73% 33.76% $29,223 $64,158 Average % $36,376 63% $ 22,546 27% $ 8,319 20% $ 4,736 $ 33,730 $ 86,127 $ 20,418 5.54% 22.82% 6% 23% 1. Evaluate the profitability (Dollars) and profitability ratios (%) of both companies for FY 2013, including: profit margin (gross and net), re- turn on assets and equity. What conclusions can you draw from your analysis? Which company, if either, is doing a better job of generating profits and returns? Keep in mind that investors focus on a company's profit growth & consistency. 2017 2018 Average 1% $ $ 55% $ 16% $ 10% $ $ $ $ 55% 16% 8% (data in millions) 2016 PepsiCo $ Net Operating Revenue/Net Sales $ 62,799 Gross Profit $ 34,577 Operating Income $ 9,804 Net Profit (Consolidated Net Income) $ 6,329 Total Current Assets $ 26,450 Total Assets $ 73,490 Equity $ 11,199 Return on Assets 8.61% Return on Equity 56.51% Total Current Liabilities $21,135 Total Liabilities $57,637 55% 12% 19% $ $ $ $ $ $ $ $ 55% 15% 12% 63,525 34,729 10,276 4,857 31,027 79,804 10,981 6.09% 44.23% $20,502 $68,823 64,661 35,280 10,110 12,515 21,893 77,648 14,602 16.12% 85.71% $22,138 $63,046 $ 63,662 $ 34,862 $ 10,063 $ 7,900 $ 26,457 $ 76,981 $ 12,261 10.27% 62.15% $ 21,258 $ 63,169 10% 62% 2017 2018 % (data in millions) 2016 Coke $ Net Operating Revenue/Net Sales $ 41,863 Gross Profit $ 25,398 Operating Income $ 8,657 Net Profit (Consolidated Net Income) $ 6,527 Total Current Assets $ 34,010 Total Assets $ 87,270 Equity $ 23,220 Return on Assets 7.48% Return on Equity 28.11% Total Current Liabilities $26,532 Total Liabilities $64,050 $ 61% $ 21% $ 16% $ $ $ $ 35,410 22,155 7,599 1,248 36,545 87,896 18,977 1.42% 6.58% $27,194 $68,9191 $ 63% $ 21% $ 4% $ $ $ $ 62% 23% 13% 31,856 20,086 8,700 6,434 30,634 83,216 19,058 7.73% 33.76% $29,223 $64,158 Average % $36,376 63% $ 22,546 27% $ 8,319 20% $ 4,736 $ 33,730 $ 86,127 $ 20,418 5.54% 22.82% 6% 23% 1. Evaluate the profitability (Dollars) and profitability ratios (%) of both companies for FY 2013, including: profit margin (gross and net), re- turn on assets and equity. What conclusions can you draw from your analysis? Which company, if either, is doing a better job of generating profits and returns? Keep in mind that investors focus on a company's profit growth & consistency

Step by Step Solution

There are 3 Steps involved in it

Step: 1

blur-text-image

Get Instant Access to Expert-Tailored Solutions

See step-by-step solutions with expert insights and AI powered tools for academic success

Step: 2

blur-text-image

Step: 3

blur-text-image

Ace Your Homework with AI

Get the answers you need in no time with our AI-driven, step-by-step assistance

Get Started

Recommended Textbook for

Survey of Accounting

Authors: Edmonds, old, Mcnair, Tsay

2nd edition

9780077392659, 978-0-07-73417, 77392655, 0-07-734177-5, 73379557, 978-0073379555

Students also viewed these Finance questions