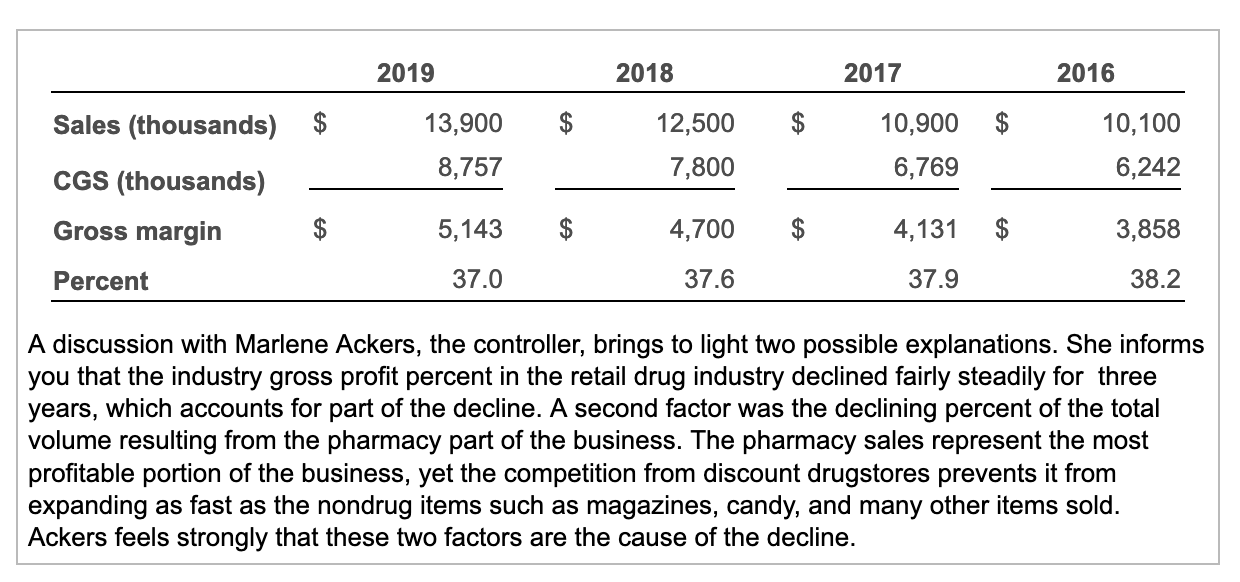
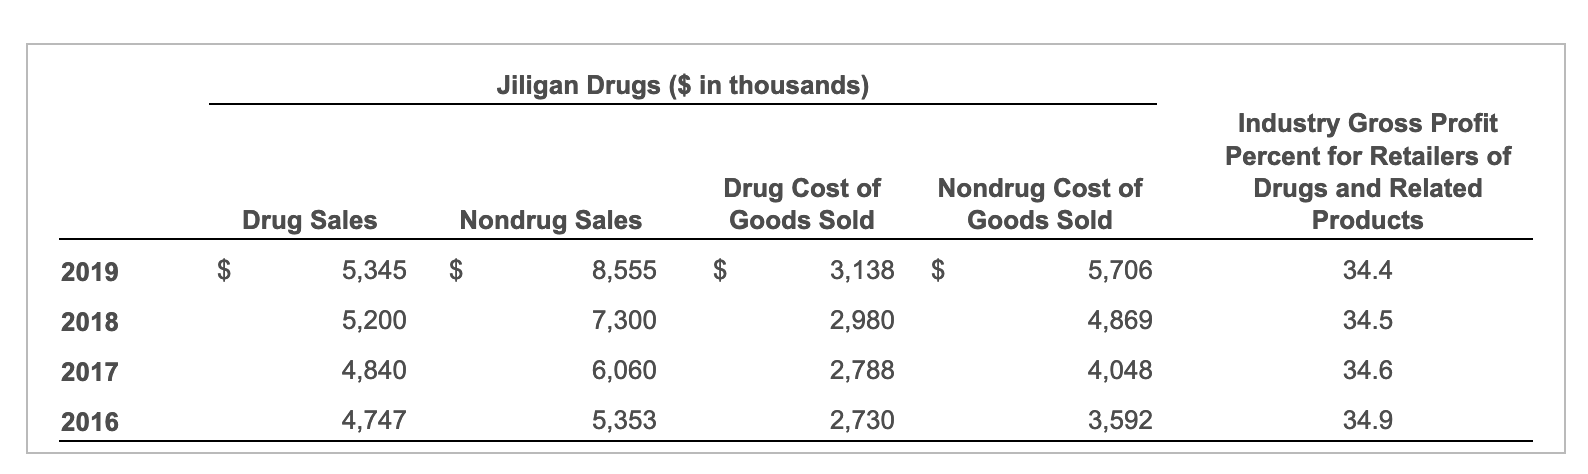
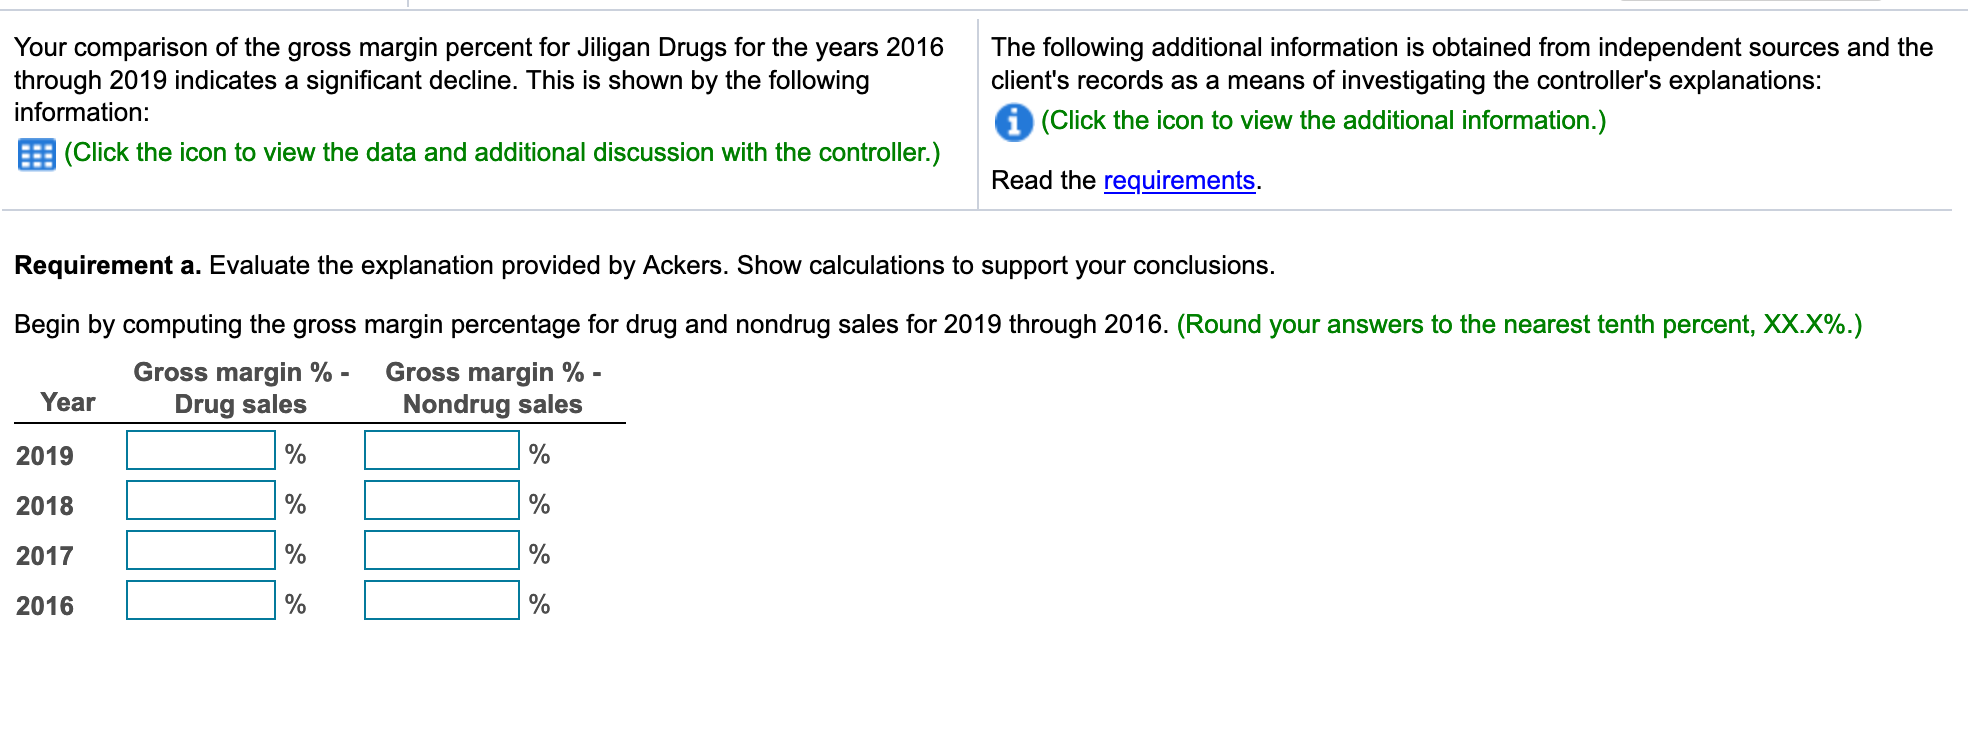
2019 2018 2017 2016 Sales (thousands) $ $ $ 13,900 8,757 12,500 7,800 10,900 6,769 10,100 6,242 CGS (thousands) Gross margin 5,143 4,700 4,131 3,858 Percent 37.0 37.6 37.9 38.2 A discussion with Marlene Ackers, the controller, brings to light two possible explanations. She informs you that the industry gross profit percent in the retail drug industry declined fairly steadily for three years, which accounts for part of the decline. A second factor was the declining percent of the total volume resulting from the pharmacy part of the business. The pharmacy sales represent the most profitable portion of the business, yet the competition from discount drugstores prevents it from expanding as fast as the nondrug items such as magazines, candy, and many other items sold. Ackers feels strongly that these two factors are the cause of the decline. Jiligan Drugs ($ in thousands) Industry Gross Profit Percent for Retailers of Drugs and Related Products Drug Cost of Goods Sold Nondrug Cost of Goods Sold Drug Sales Nondrug Sales $ 8,555 2019 5,345 $ 3,138 $ 5,706 34.4 2018 5,200 7,300 2,980 4,869 34.5 2017 4,840 6,060 2,788 4,048 34.6 2016 4,747 5,353 2,730 3,592 34.9 Your comparison of the gross margin percent for Jiligan Drugs for the years 2016 through 2019 indicates a significant decline. This is shown by the following information: (Click the icon to view the data and additional discussion with the controller.) The following additional information is obtained from independent sources and the client's records as a means of investigating the controller's explanations: (Click the icon to view the additional information.) Read the requirements. Requirement a. Evaluate the explanation provided by Ackers. Show calculations to support your conclusions. Begin by computing the gross margin percentage for drug and nondrug sales for 2019 through 2016. (Round your answers to the nearest tenth percent, XX.X%.) Gross margin % - Gross margin % - Year Drug sales Nondrug sales 2019 % % 2018 % % 2017 % % 2016 % %