

Answered step by step
Verified Expert Solution
Question
1 Approved Answer
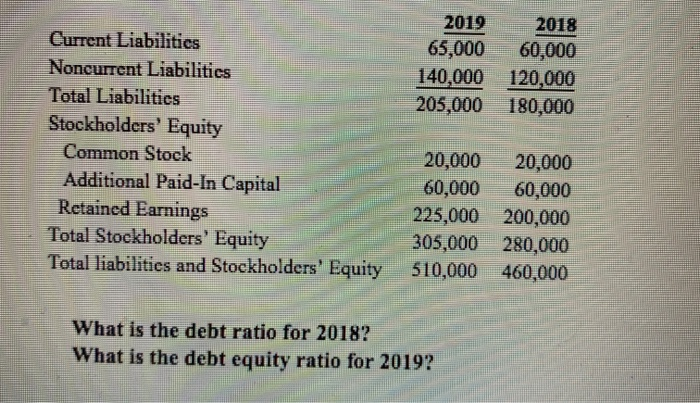
2019 2018 65,000 60,000 140,000 120,000 205,000 180,000 Current Liabilitics Noncurrent Liabilities Total Liabilities Stockholders' Equity Common Stock Additional Paid-In Capital Retained Earnings Total Stockholders'
Step by Step Solution
There are 3 Steps involved in it
Step: 1

Get Instant Access to Expert-Tailored Solutions
See step-by-step solutions with expert insights and AI powered tools for academic success
Step: 2

Step: 3
Ace Your Homework with AI
Get the answers you need in no time with our AI-driven, step-by-step assistance
Get Started
Managerial Accounting Creating Value in a Dynamic Business Environment
Authors: Ronald Hilton, David Platt
10th edition
78025664, 978-0078025662