

Answered step by step
Verified Expert Solution
Question
1 Approved Answer
2019 2018 Current ratio (Round to three decimal places.) 2019 2018 Quick ratio (Round to three decimal places.) 2019 2018 Inventory turnover (Round to three
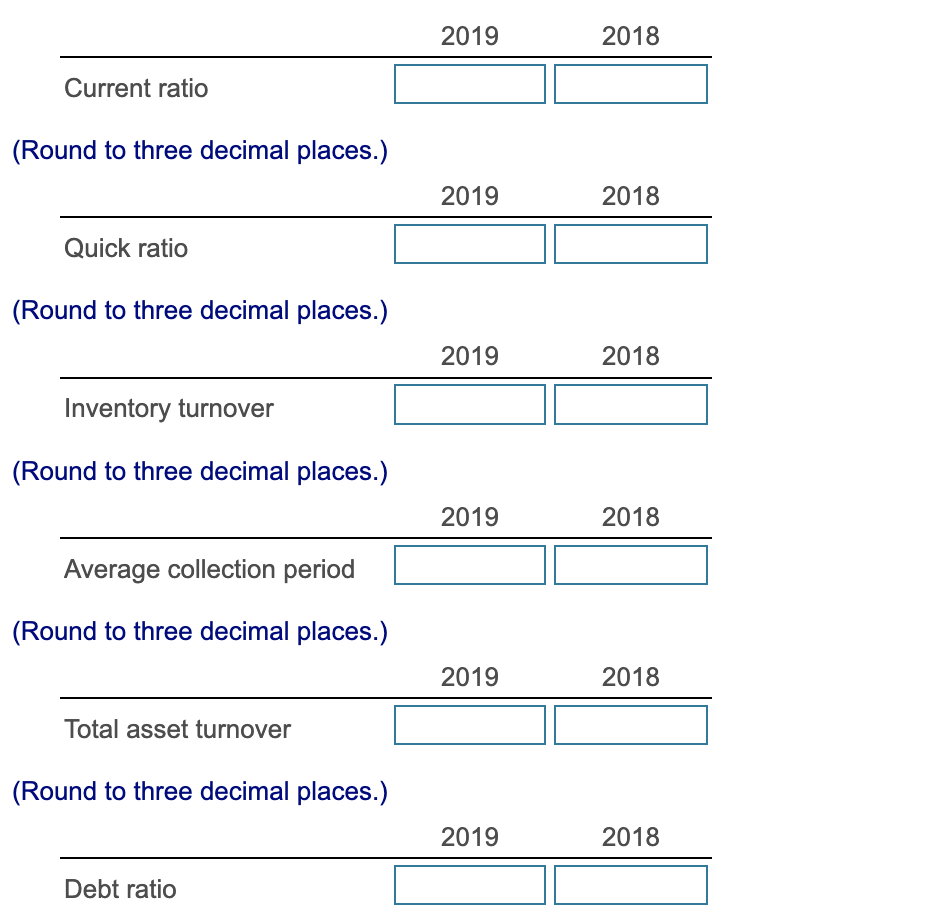
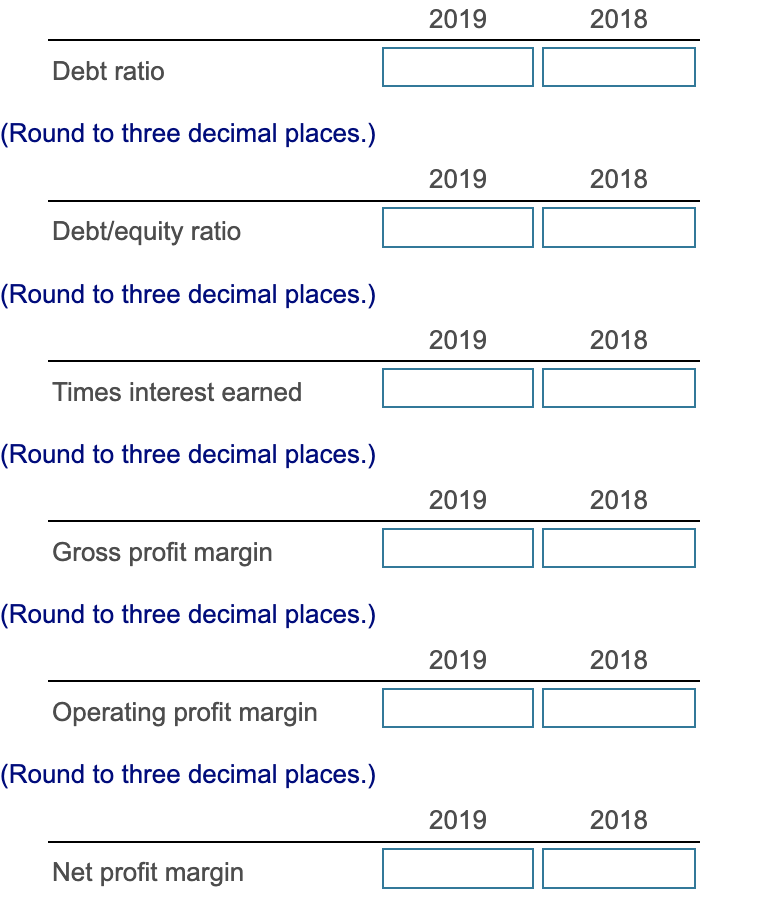
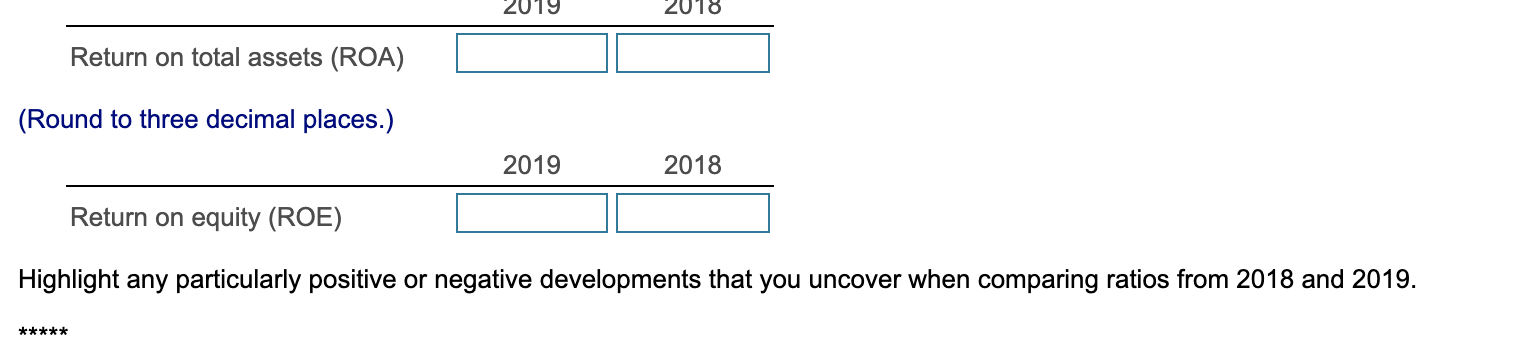
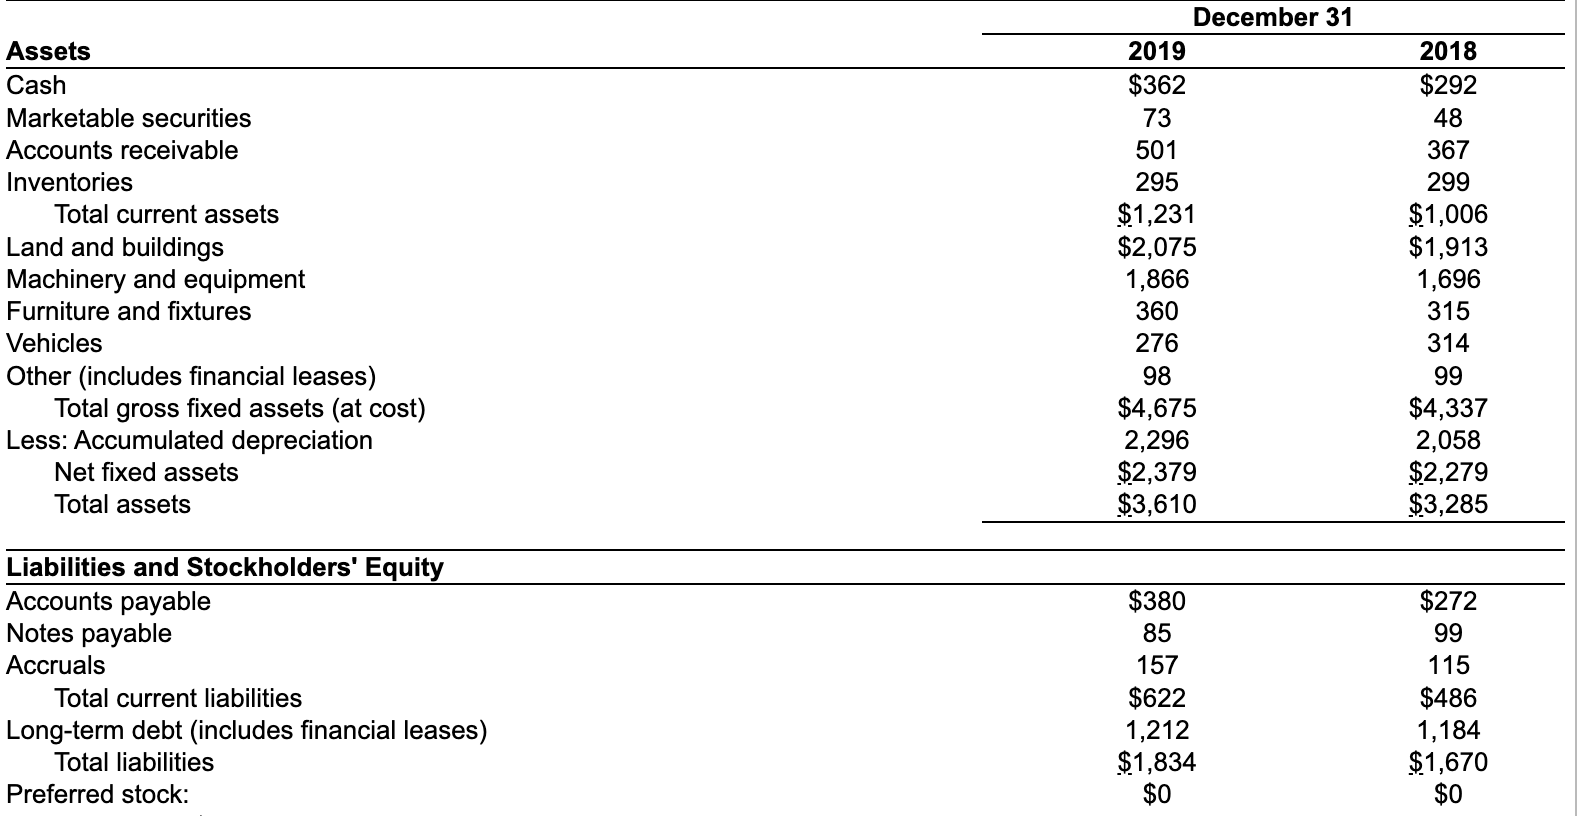
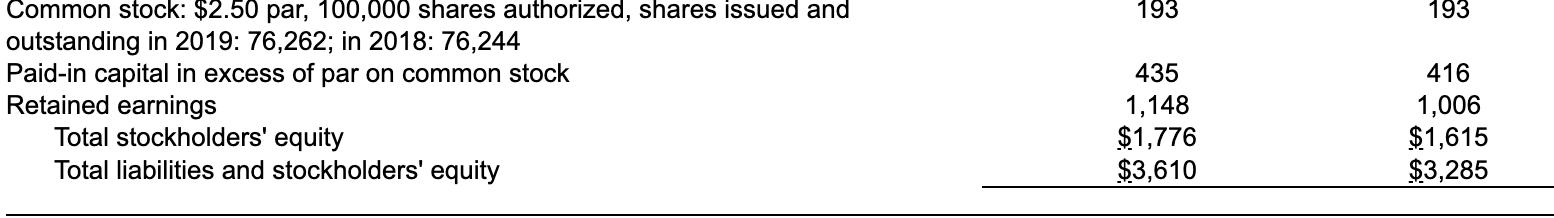
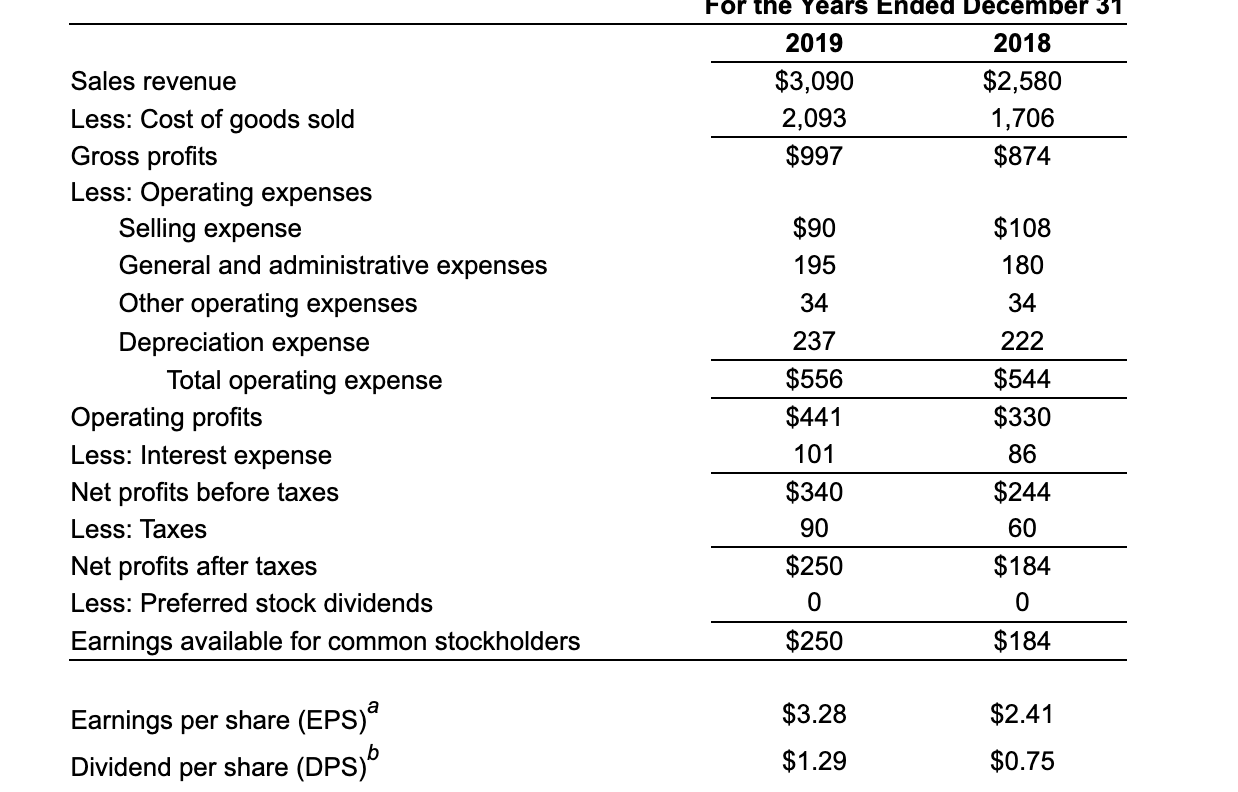
2019 2018 Current ratio (Round to three decimal places.) 2019 2018 Quick ratio (Round to three decimal places.) 2019 2018 Inventory turnover (Round to three decimal places.) 2019 2018 Average collection period (Round to three decimal places.) 2019 2018 Total asset turnover (Round to three decimal places.) 2019 2018 Debt ratio 2019 2018 Debt ratio (Round to three decimal places.) 2019 2018 Debt/equity ratio (Round to three decimal places.) 2019 2018 Times interest earned (Round to three decimal places.) 2019 2018 Gross profit margin (Round to three decimal places.) 2019 2018 Operating profit margin (Round to three decimal places.) 2019 2018 Net profit margin 2019 2018 Return on total assets (ROA) (Round to three decimal places.) 2019 2018 Return on equity (ROE) Highlight any particularly positive or negative developments that you uncover when comparing ratios from 2018 and 2019. ***** Assets Cash Marketable securities Accounts receivable Inventories Total current assets Land and buildings Machinery and equipment Furniture and fixtures Vehicles Other (includes financial leases) Total gross fixed assets (at cost) Less: Accumulated depreciation Net fixed assets Total assets December 31 2019 $362 73 501 295 $1,231 $2,075 1,866 360 276 98 $4,675 2,296 $2,379 $3,610 2018 $292 48 367 299 $1,006 $1,913 1,696 315 314 99 $4,337 2,058 $2,279 $3,285 Liabilities and Stockholders' Equity Accounts payable Notes payable Accruals Total current liabilities Long-term debt (includes financial leases) Total liabilities Preferred stock: $380 85 157 $622 1,212 $1,834 $0 $272 99 115 $486 1,184 $1,670 $0 193 193 Common stock: $2.50 par, 100,000 shares authorized, shares issued and outstanding in 2019: 76,262; in 2018: 76,244 Paid-in capital in excess of par on common stock Retained earnings Total stockholders' equity Total liabilities and stockholders' equity 435 1,148 $1,776 $3,610 416 1,006 $1,615 $3,285 For the Years Ended December 31 2019 2018 $3,090 $2,580 2,093 1,706 $997 $874 $90 195 $108 180 34 34 237 222 Sales revenue Less: Cost of goods sold Gross profits Less: Operating expenses Selling expense General and administrative expenses Other operating expenses Depreciation expense Total operating expense Operating profits Less: Interest expense Net profits before taxes Less: Taxes Net profits after taxes Less: Preferred stock dividends Earnings available for common stockholders $556 $441 101 $340 90 $250 0 $250 $544 $330 86 $244 60 $184 0 $184 a $3.28 $2.41 Earnings per share (EPS) Dividend per share (DPS) b $1.29 $0.75
Step by Step Solution
There are 3 Steps involved in it
Step: 1

Get Instant Access to Expert-Tailored Solutions
See step-by-step solutions with expert insights and AI powered tools for academic success
Step: 2

Step: 3
Ace Your Homework with AI
Get the answers you need in no time with our AI-driven, step-by-step assistance
Get Started
Health Care Budgeting And Financial Management
Authors: William J. Ward Jr.
2nd Edition
1440833052, 9781440833052