20-2*


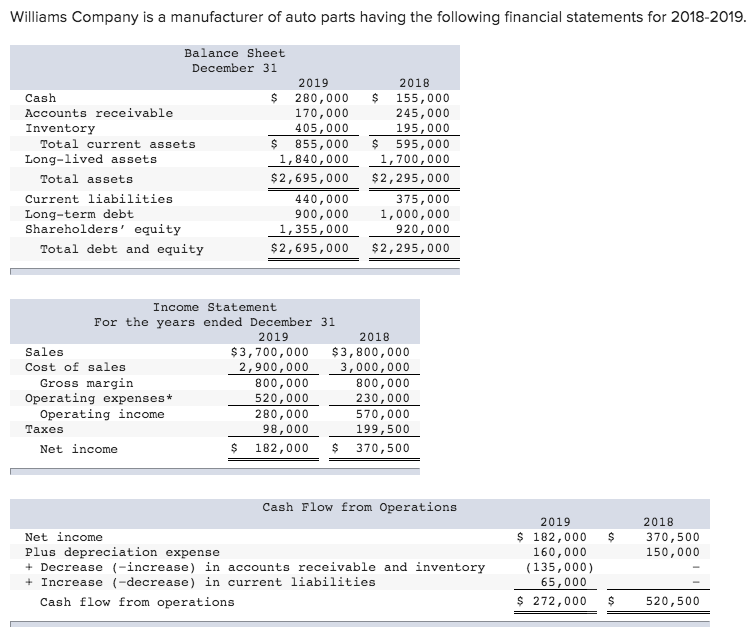
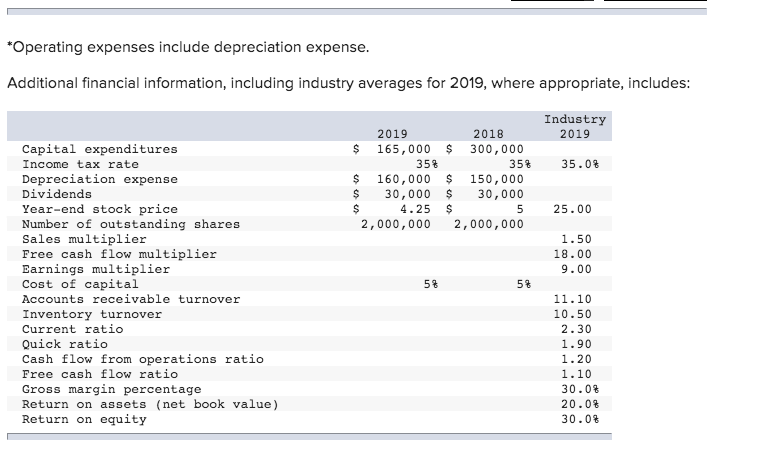
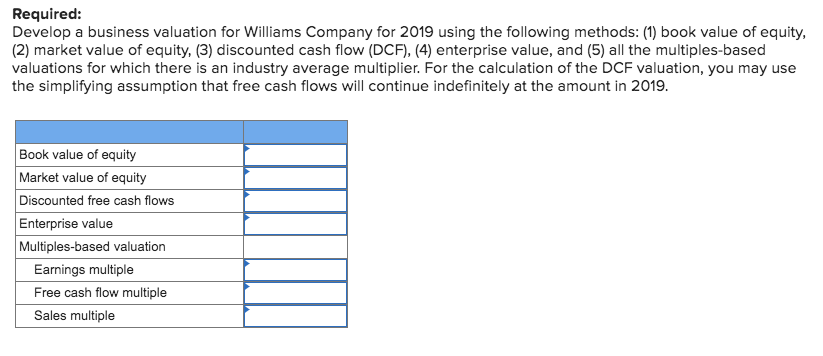
Williams Company is a manufacturer of auto parts having the following financial statements for 2018-2019. Balance Sheet December 31 2019 Cash $ 280,000 Accounts receivable 170,000 Inventory 405,000 Total current assets $ 855,000 Long-lived assets 1,840,000 Total assets $2,695,000 Current liabilities 440,000 Long-term debt 900,000 Shareholders' equity 1,355,000 Total debt and equity $2,695,000 2018 $ 155,000 245,000 195,000 $ 595,000 1,700,000 $2,295,000 375,000 1,000,000 920,000 $2,295,000 Income Statement For the years ended December 31 2019 2018 Sales $3,700,000 $3,800,000 Cost of sales 2,900,000 3,000,000 Gross margin 800,000 800,000 Operating expenses 520,000 230,000 Operating income 280,000 570,000 Taxes 98,000 199,500 Net income $ 182,000 $ 370,500 Cash Flow from Operations 2019 $ 2018 370,500 150,000 Net income Plus depreciation expense + Decrease (-increase) in accounts receivable and inventory + Increase (-decrease) in current liabilities Cash flow from operations $ 182,000 160,000 (135,000) 65,000 $ 272,000 $ 520,500 *Operating expenses include depreciation expense. Additional financial information, including industry averages for 2019, where appropriate, includes: Industry 2019 35.0% 2019 2018 $ 165,000 $ 300,000 35% 35% $ 160,000 $ 150,000 $ 30,000 $ 30,000 $ 4.25 $ 2,000,000 2,000,000 25.00 1.50 18.00 9.00 Capital expenditures Income tax rate Depreciation expense Dividends Year-end stock price Number of outstanding shares Sales multiplier Free cash flow multiplier Earnings multiplier Cost of capital Accounts receivable turnover Inventory turnover Current ratio Quick ratio Cash flow from operations ratio Free cash flow ratio Gross margin percentage Return on assets (net book value) Return on equity 11.10 10.50 2.30 1.90 1.20 1.10 30.0% 20.0% 30.07 Required: Develop a business valuation for Williams Company for 2019 using the following methods: (1) book value of equity, (2) market value of equity. (3) discounted cash flow (DCF), (4) enterprise value, and (5) all the multiples-based valuations for which there is an industry average multiplier. For the calculation of the DCF valuation, you may use the simplifying assumption that free cash flows will continue indefinitely at the amount in 2019. Book value of equity Market value of equity Discounted free cash flows Enterprise value Multiples-based valuation Earnings multiple Free cash flow multiple Sales multiple Williams Company is a manufacturer of auto parts having the following financial statements for 2018-2019. Balance Sheet December 31 2019 Cash $ 280,000 Accounts receivable 170,000 Inventory 405,000 Total current assets $ 855,000 Long-lived assets 1,840,000 Total assets $2,695,000 Current liabilities 440,000 Long-term debt 900,000 Shareholders' equity 1,355,000 Total debt and equity $2,695,000 2018 $ 155,000 245,000 195,000 $ 595,000 1,700,000 $2,295,000 375,000 1,000,000 920,000 $2,295,000 Income Statement For the years ended December 31 2019 2018 Sales $3,700,000 $3,800,000 Cost of sales 2,900,000 3,000,000 Gross margin 800,000 800,000 Operating expenses 520,000 230,000 Operating income 280,000 570,000 Taxes 98,000 199,500 Net income $ 182,000 $ 370,500 Cash Flow from Operations 2019 $ 2018 370,500 150,000 Net income Plus depreciation expense + Decrease (-increase) in accounts receivable and inventory + Increase (-decrease) in current liabilities Cash flow from operations $ 182,000 160,000 (135,000) 65,000 $ 272,000 $ 520,500 *Operating expenses include depreciation expense. Additional financial information, including industry averages for 2019, where appropriate, includes: Industry 2019 35.0% 2019 2018 $ 165,000 $ 300,000 35% 35% $ 160,000 $ 150,000 $ 30,000 $ 30,000 $ 4.25 $ 2,000,000 2,000,000 25.00 1.50 18.00 9.00 Capital expenditures Income tax rate Depreciation expense Dividends Year-end stock price Number of outstanding shares Sales multiplier Free cash flow multiplier Earnings multiplier Cost of capital Accounts receivable turnover Inventory turnover Current ratio Quick ratio Cash flow from operations ratio Free cash flow ratio Gross margin percentage Return on assets (net book value) Return on equity 11.10 10.50 2.30 1.90 1.20 1.10 30.0% 20.0% 30.07 Required: Develop a business valuation for Williams Company for 2019 using the following methods: (1) book value of equity, (2) market value of equity. (3) discounted cash flow (DCF), (4) enterprise value, and (5) all the multiples-based valuations for which there is an industry average multiplier. For the calculation of the DCF valuation, you may use the simplifying assumption that free cash flows will continue indefinitely at the amount in 2019. Book value of equity Market value of equity Discounted free cash flows Enterprise value Multiples-based valuation Earnings multiple Free cash flow multiple Sales multiple


