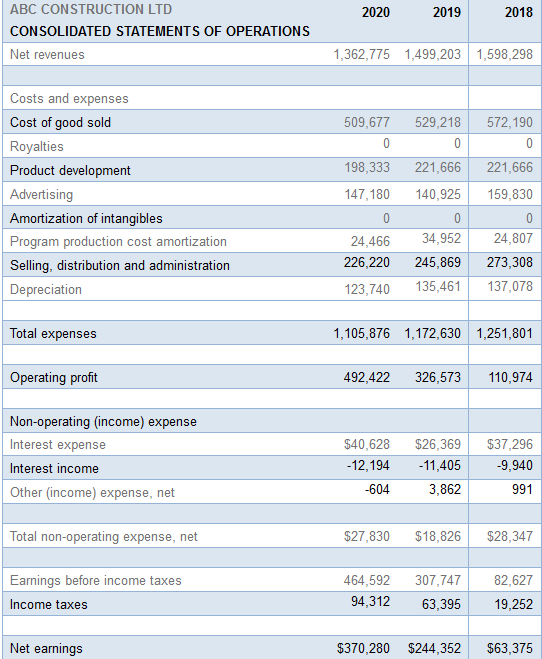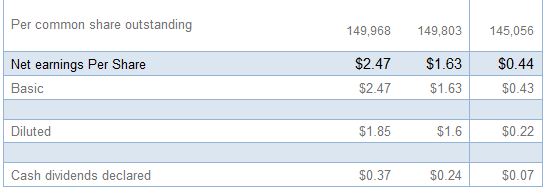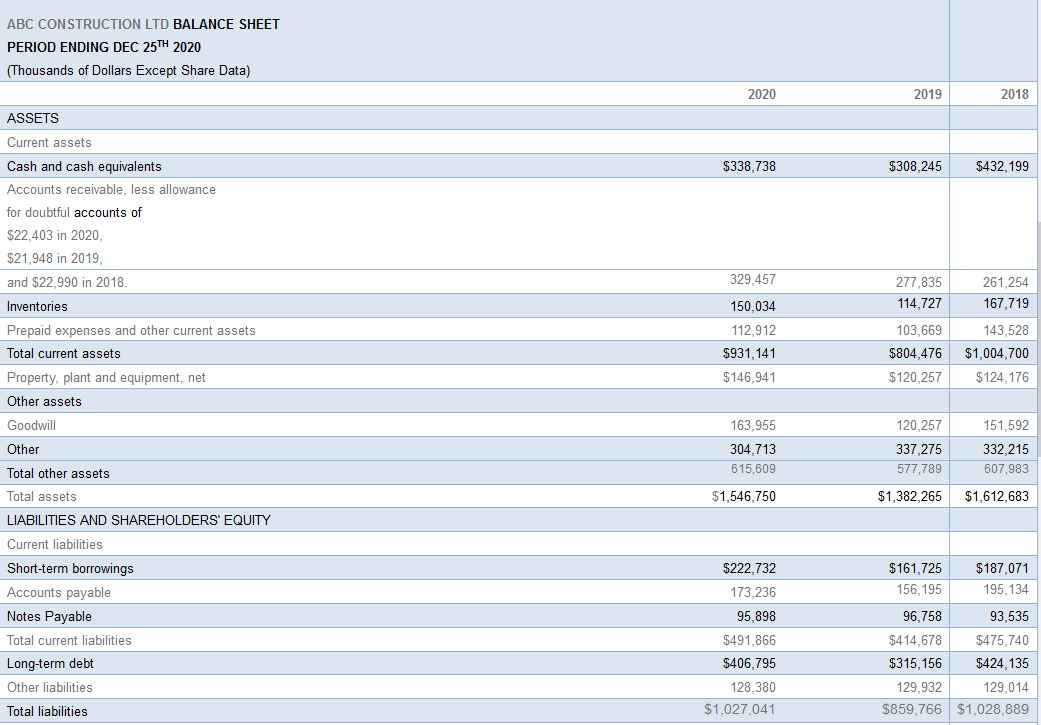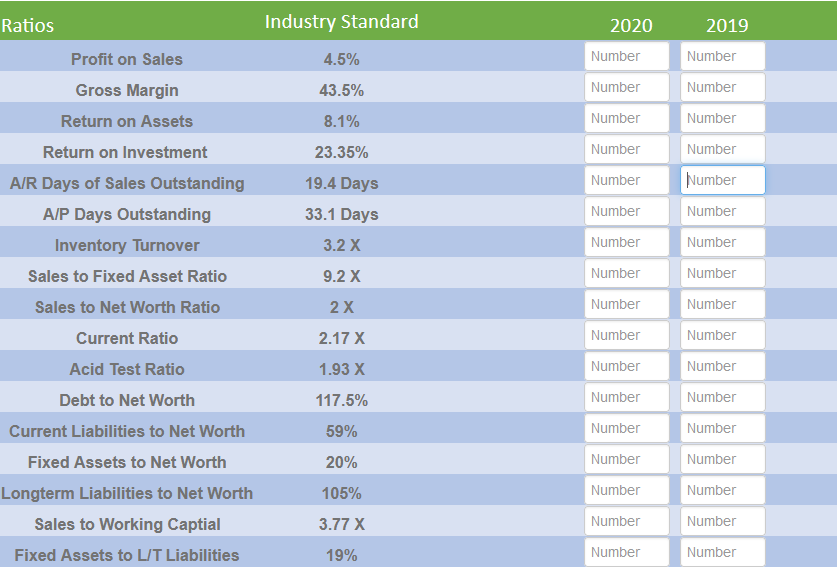


2020 2019 2018 ABC CONSTRUCTION LTD CONSOLIDATED STATEMENTS OF OPERATIONS Net revenues 1,362,775 1,499,203 1,598,298 509,677 0 572,190 0 221,666 Costs and expenses Cost of good sold Royalties Product development Advertising Amortization of intangibles Program production cost amortization Selling, distribution and administration Depreciation 198,333 147,180 0 24,466 226,220 529,218 0 221,666 140,925 0 34,952 245,869 135,461 159,830 0 24,807 273,308 137,078 123,740 Total expenses 1,105,876 1,172,630 1,251,801 Operating profit 492,422 326,573 110,974 Non-operating (income) expense Interest expense Interest income Other (income) expense, net $40,628 -12,194 -604 $26,369 -11,405 3,862 $37,296 -9,940 991 Total non-operating expense, net $27,830 $18,826 $28,347 Earnings before income taxes Income taxes 464,592 94,312 307,747 63,395 82,627 19,252 Net earnings $370,280 $244,352 $63,375 Per common share outstanding 149,968 149,803 145,056 $2.47 Net earnings Per Share Basic $1.63 $1.63 $0.44 $0.43 $2.47 Diluted $1.85 $1.6 $0.22 Cash dividends declared $0.37 $0.24 $0.07 ABC CONSTRUCTION LTD BALANCE SHEET PERIOD ENDING DEC 25TH 2020 (Thousands of Dollars Except Share Data) 2020 2019 2018 ASSETS $338.738 $308,245 $432,199 Current assets Cash and cash equivalents Accounts receivable, less allowance for doubtful accounts of $22.403 in 2020, $21,948 in 2019, and $22.990 in 2018 329,457 277,835 114,727 261,254 167,719 Inventories Prepaid expenses and other current assets Total current assets Property, plant and equipment, net Other assets 150,034 112,912 $931,141 $146,941 103,669 $804,476 $120,257 143,528 $1,004,700 $124,176 Goodwill 120.257 Other 163,955 304,713 615,609 337,275 577,789 151,592 332,215 607,983 Total other assets Total assets $1,546,750 $1,382,265 $1,612,683 LIABILITIES AND SHAREHOLDERS' EQUITY $161.725 156,195 $187,071 195, 134 Current liabilities Short-term borrowings Accounts payable Notes Payable Total current liabilities Long-term debt Other liabilities $222,732 173,236 95,898 $491,866 $406,795 128,380 $1,027,041 96,758 93,535 $414,678 $475,740 $315, 156 $424. 135 129,932 129,014 $859,766 $1,028,889 Total liabilities Shareholders' equity Preference stock of $2.50 par value. Authorized 5,000,000 shares, none issued 332,928 332,562 322,024 Common stock of $2.22 par value. Authorized and 2020 300,000 shares, issued 149,968 shares in 2020 Additional paid-in capital Retained earnings Accumulated other comprehensive (loss) earnings -288,881 676,411 -200,748 -137,346 361,620 68,385 153,221 -34,336 40,163 Total shareholders' equity 519.709 522,499 583,794 Total liabilities and shareholders' equity $1,546,750 $1,382,265 1,612,683 Industry Standard 2020 Number 4.5% 43.5% 2019 Number Number Number 8.1% Number Number Number Number 23.35% 19.4 Days 33.1 Days Number Number Number Number 3.2 X Number Number 9.2 X Number Number Ratios Profit on Sales Gross Margin Return on Assets Return on Investment A/R Days of Sales Outstanding A/P Days Outstanding Inventory Turnover Sales to Fixed Asset Ratio Sales to Net Worth Ratio Current Ratio Acid Test Ratio Debt to Net Worth Current Liabilities to Net Worth Fixed Assets to Net Worth Longterm Liabilities to Net Worth Sales to Working Captial Fixed Assets to LIT Liabilities 2x Number Number 2.17 X 1.93 X Number Number Number Number Number 117.5% Number 59% Number Number 20% Number Number 105% Number Number 3.77 X Number Number 19% Number Number 2020 2019 2018 ABC CONSTRUCTION LTD CONSOLIDATED STATEMENTS OF OPERATIONS Net revenues 1,362,775 1,499,203 1,598,298 509,677 0 572,190 0 221,666 Costs and expenses Cost of good sold Royalties Product development Advertising Amortization of intangibles Program production cost amortization Selling, distribution and administration Depreciation 198,333 147,180 0 24,466 226,220 529,218 0 221,666 140,925 0 34,952 245,869 135,461 159,830 0 24,807 273,308 137,078 123,740 Total expenses 1,105,876 1,172,630 1,251,801 Operating profit 492,422 326,573 110,974 Non-operating (income) expense Interest expense Interest income Other (income) expense, net $40,628 -12,194 -604 $26,369 -11,405 3,862 $37,296 -9,940 991 Total non-operating expense, net $27,830 $18,826 $28,347 Earnings before income taxes Income taxes 464,592 94,312 307,747 63,395 82,627 19,252 Net earnings $370,280 $244,352 $63,375 Per common share outstanding 149,968 149,803 145,056 $2.47 Net earnings Per Share Basic $1.63 $1.63 $0.44 $0.43 $2.47 Diluted $1.85 $1.6 $0.22 Cash dividends declared $0.37 $0.24 $0.07 ABC CONSTRUCTION LTD BALANCE SHEET PERIOD ENDING DEC 25TH 2020 (Thousands of Dollars Except Share Data) 2020 2019 2018 ASSETS $338.738 $308,245 $432,199 Current assets Cash and cash equivalents Accounts receivable, less allowance for doubtful accounts of $22.403 in 2020, $21,948 in 2019, and $22.990 in 2018 329,457 277,835 114,727 261,254 167,719 Inventories Prepaid expenses and other current assets Total current assets Property, plant and equipment, net Other assets 150,034 112,912 $931,141 $146,941 103,669 $804,476 $120,257 143,528 $1,004,700 $124,176 Goodwill 120.257 Other 163,955 304,713 615,609 337,275 577,789 151,592 332,215 607,983 Total other assets Total assets $1,546,750 $1,382,265 $1,612,683 LIABILITIES AND SHAREHOLDERS' EQUITY $161.725 156,195 $187,071 195, 134 Current liabilities Short-term borrowings Accounts payable Notes Payable Total current liabilities Long-term debt Other liabilities $222,732 173,236 95,898 $491,866 $406,795 128,380 $1,027,041 96,758 93,535 $414,678 $475,740 $315, 156 $424. 135 129,932 129,014 $859,766 $1,028,889 Total liabilities Shareholders' equity Preference stock of $2.50 par value. Authorized 5,000,000 shares, none issued 332,928 332,562 322,024 Common stock of $2.22 par value. Authorized and 2020 300,000 shares, issued 149,968 shares in 2020 Additional paid-in capital Retained earnings Accumulated other comprehensive (loss) earnings -288,881 676,411 -200,748 -137,346 361,620 68,385 153,221 -34,336 40,163 Total shareholders' equity 519.709 522,499 583,794 Total liabilities and shareholders' equity $1,546,750 $1,382,265 1,612,683 Industry Standard 2020 Number 4.5% 43.5% 2019 Number Number Number 8.1% Number Number Number Number 23.35% 19.4 Days 33.1 Days Number Number Number Number 3.2 X Number Number 9.2 X Number Number Ratios Profit on Sales Gross Margin Return on Assets Return on Investment A/R Days of Sales Outstanding A/P Days Outstanding Inventory Turnover Sales to Fixed Asset Ratio Sales to Net Worth Ratio Current Ratio Acid Test Ratio Debt to Net Worth Current Liabilities to Net Worth Fixed Assets to Net Worth Longterm Liabilities to Net Worth Sales to Working Captial Fixed Assets to LIT Liabilities 2x Number Number 2.17 X 1.93 X Number Number Number Number Number 117.5% Number 59% Number Number 20% Number Number 105% Number Number 3.77 X Number Number 19% Number Number


