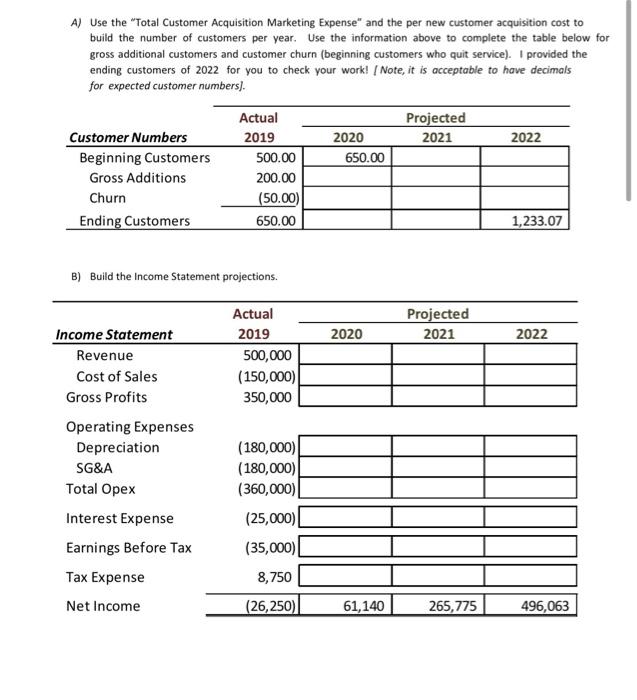
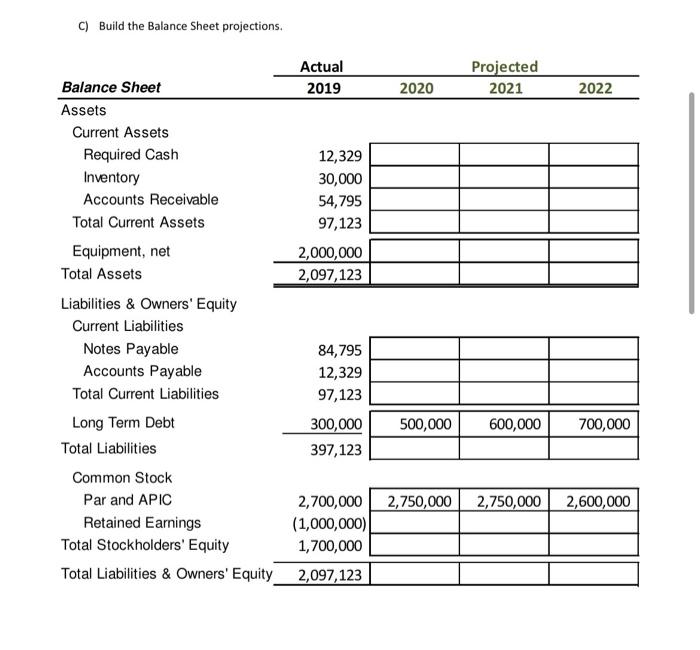
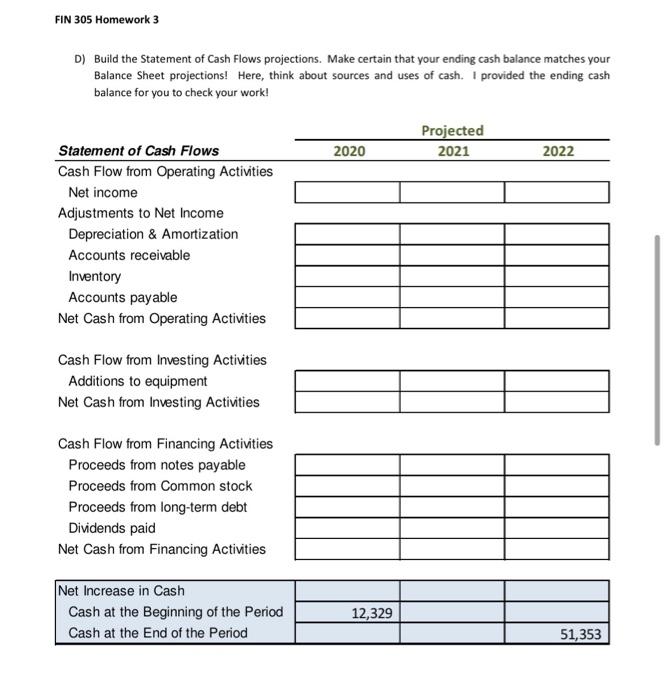
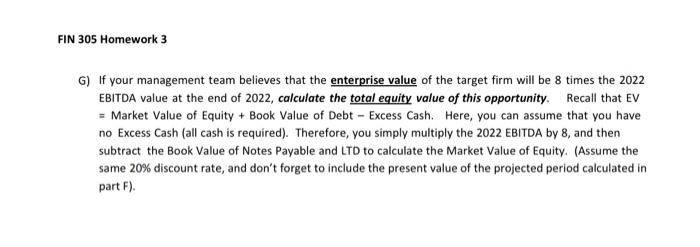
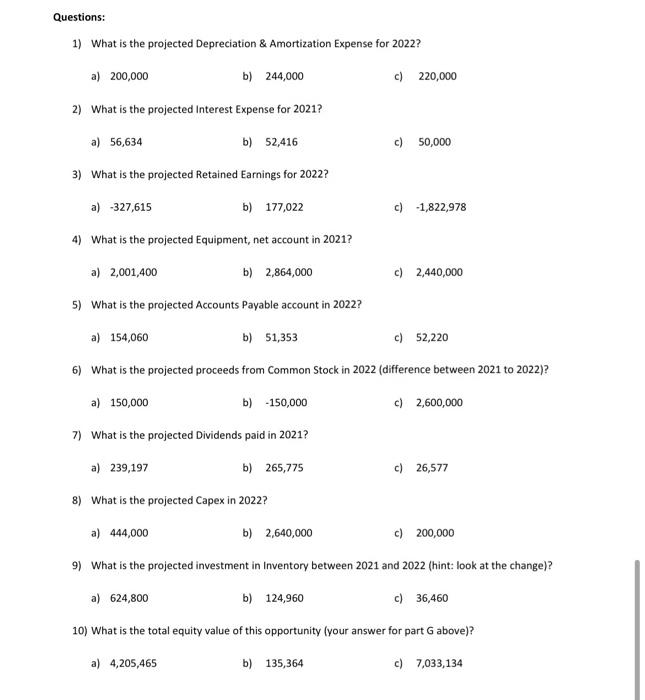
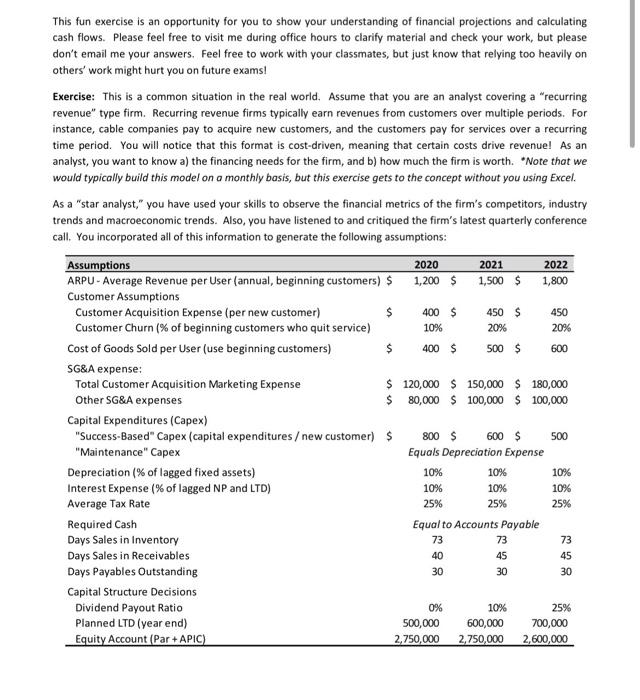
2020 This fun exercise is an opportunity for you to show your understanding of financial projections and calculating cash flows. Please feel free to visit me during office hours to clarify material and check your work, but please don't email me your answers. Feel free to work with your classmates, but just know that relying too heavily on others' work might hurt you on future exams! Exercise: This is a common situation in the real world. Assume that you are an analyst covering a "recurring revenue" type firm. Recurring revenue firms typically earn revenues from customers over multiple periods. For instance, cable companies pay to acquire new customers, and the customers pay for services over a recurring time period. You will notice that this format is cost-driven, meaning that certain costs drive revenue! As an analyst, you want to know a) the financing needs for the firm, and b) how much the firm is worth. *Note that we would typically build this model on a monthly basis, but this exercise gets to the concept without you using Excel. As a "star analyst," you have used your skills to observe the financial metrics of the firm's competitors, industry trends and macroeconomic trends. Also, you have listened to and critiqued the firm's latest quarterly conference call. You incorporated all of this information to generate the following assumptions: Assumptions 2021 2022 ARPU - Average Revenue per User (annual, beginning customers) $ 1,200 $ 1,500 $ 1,800 Customer Assumptions Customer Acquisition Expense (per new customer) $ 400 $ 450 $ 450 Customer Churn (% of beginning customers who quit service) 10% 20% 20% Cost of Goods Sold per User (use beginning customers) $ 400 $ 500 $ 600 SG&A expense: Total Customer Acquisition Marketing Expense $ 120,000 $150,000 $ 180,000 Other SG&A expenses $ 80,000 $ 100,000 $100,000 Capital Expenditures (Capex) "Success-Based" Capex (capital expenditures / new customers 800 600 $ "Maintenance" Capex Equals Depreciation Expense Depreciation (% of lagged fixed assets) 10% 10% 10% Interest Expense (% of lagged NP and LTD) 10% 10% 10% Average Tax Rate 25% 25% 25% Required Cash Equal to Accounts Payable Days Sales in Inventory 73 73 73 Days Sales in Receivables 40 45 45 Days Payables Outstanding 30 30 30 Capital Structure Decisions Dividend Payout Ratio 10% 25% Planned LTD (year end) 500,000 600,000 700,000 Equity Account (Par+APIC) 2,750,000 2,750,000 2,600,000 500 0% A) Use the "Total Customer Acquisition Marketing Expense" and the per new customer acquisition cost to build the number of customers per year. Use the information above to complete the table below for gross additional customers and customer churn (beginning customers who quit service). I provided the ending customers of 2022 for you to check your work! Note, it is acceptable to have decimals for expected customer numbers). Projected 2021 2022 2020 650.00 Customer Numbers Beginning Customers Gross Additions Churn Ending Customers Actual 2019 500.00 200.00 (50.00) 650.00 1,233.07 B) Build the Income Statement projections. Projected 2021 2020 2022 Actual 2019 500,000 (150,000) 350,000 Income Statement Revenue Cost of Sales Gross Profits Operating Expenses Depreciation SG&A Total Opex Interest Expense Earnings Before Tax Tax Expense Net Income (180,000) (180,000) (360,000) (25,000) (35,000) 8,750 (26,250) 61,140 265,775 496,063 C) Build the Balance Sheet projections. 2022 Actual Projected Balance Sheet 2019 2020 2021 Assets Current Assets Required Cash 12,329 Inventory 30,000 Accounts Receivable 54,795 Total Current Assets 97,123 Equipment, net 2,000,000 Total Assets 2,097,123 Liabilities & Owners' Equity Current Liabilities Notes Payable 84,795 Accounts Payable 12,329 Total Current Liabilities 97,123 Long Term Debt 300,000 500,000 600,000 Total Liabilities 397,123 Common Stock Par and APIC 2,700,000 2,750,000 2,750,000 Retained Earnings (1,000,000) Total Stockholders' Equity 1,700,000 Total Liabilities & Owners' Equity 2,097,123 700,000 2,600,000 FIN 305 Homework 3 D) Build the Statement of Cash Flows projections. Make certain that your ending cash balance matches your Balance Sheet projections! Here, think about sources and uses of cash. I provided the ending cash balance for you to check your work! Projected 2021 2020 2022 Statement of Cash Flows Cash Flow from Operating Activities Net income Adjustments to Net Income Depreciation & Amortization Accounts receivable Inventory Accounts payable Net Cash from Operating Activities Cash Flow from Investing Activities Additions to equipment Net Cash from Investing Activities Cash Flow from Financing Activities Proceeds from notes payable Proceeds from Common stock Proceeds from long-term debt Dividends paid Net Cash from Financing Activities Net Increase in Cash Cash at the Beginning of the Period Cash at the End of the Period 12,329 51,353 FIN 30 Homework 3 E) Given the above assumptions, calculate the Cash Flow from Assets (CFFA) and the Cash Flow to Equity (CFE) for 2020, 2021 and 2022. F) We want to know the value of this projection plan to shareholders. Compute the Present Value of the Cash Flows to Equity during the Projected Period (assuming that they come at year's end). Assume that the required rate of return for equity holders is 20%. Hint: You should only have three cash flows here! FIN 305 Homework 3 G) If your management team believes that the enterprise value of the target firm will be 8 times the 2022 EBITDA value at the end of 2022, calculate the total equity value of this opportunity. Recall that eV = Market Value of Equity + Book Value of Debt - Excess Cash. Here, you can assume that you have no Excess Cash (all cash is required). Therefore, you simply multiply the 2022 EBITDA by 8, and then subtract the Book Value of Notes Payable and LTD to calculate the Market Value of Equity(Assume the same 20% discount rate, and don't forget to include the present value of the projected period calculated in part F). Questions: 1) What is the projected Depreciation & Amortization Expense for 2022? a) 200,000 b) 244,000 c) 220,000 2) What is the projected interest Expense for 2021? a) 56,634 b) 52,416 c) 50,000 3) What is the projected Retained Earnings for 2022? a) -327,615 b) 177,022 c) 1,822,978 4) What is the projected Equipment, net account in 2021? a) 2,001,400 b) 2,864,000 c) 2,440,000 5) What is the projected Accounts Payable account in 2022? a) 154,060 b) 51,353 c) 52,220 6) What is the projected proceeds from Common Stock in 2022 (difference between 2021 to 2022)? a) 150,000 b) 150,000 c) 2,600,000 7) What is the projected Dividends paid in 2021? a) 239,197 b) 265,775 c) 26,577 8) What is the projected Capex in 2022? a) 444,000 b) 2,640,000 c) 200,000 9) What is the projected investment in Inventory between 2021 and 2022 (hint: look at the change)? a) 624,800 b) 124,960 c) 36,460 10) What is the total equity value of this opportunity (your answer for part G above)? a) 4,205,465 b) 135,364 c) 7,033,134 2021 450 This fun exercise is an opportunity for you to show your understanding of financial projections and calculating cash flows. Please feel free to visit me during office hours to clarify material and check your work, but please don't email me your answers. Feel free to work with your classmates, but just know that relying too heavily on others' work might hurt you on future exams! Exercise: This is a common situation in the real world. Assume that you are an analyst covering a "recurring revenue" type firm. Recurring revenue firms typically earn revenues from customers over multiple periods. For instance, cable companies pay to acquire new customers, and the customers pay for services over a recurring time period. You will notice that this format is cost-driven, meaning that certain costs drive revenue! As an analyst, you want to know a) the financing needs for the firm, and b) how much the firm is worth. "Note that we would typically build this model on a monthly basis, but this exercise gets to the concept without you using Excel. As a "star analyst," you have used your skills to observe the financial metrics of the firm's competitors, industry trends and macroeconomic trends. Also, you have listened to and critiqued the firm's latest quarterly conference call. You incorporated all of this information to generate the following assumptions: Assumptions 2020 2022 ARPU - Average Revenue per User (annual, beginning customers) $ 1,200 $ 1,500 $ 1,800 Customer Assumptions Customer Acquisition Expense (per new customer) $ 400 $ 450 $ Customer Churn (% of beginning customers who quit service) 10% 20% 20% Cost of Goods Sold per User (use beginning customers) $ 400 $ 500 $ 600 SG&A expense: Total Customer Acquisition Marketing Expense $ 120,000 $ 150,000 $ 180,000 Other SG&A expenses $ 80,000 $ 100,000 $ 100,000 Capital Expenditures (Capex) "Success-Based" Capex (capital expenditures / new customer) $ 800 $ 600 $ 500 "Maintenance" Capex Equals Depreciation Expense Depreciation (% of lagged fixed assets) 10% 10% 10% Interest Expense (% of lagged NP and LTD) 10% 10% 10% Average Tax Rate 25% 25% 25% Required Cash Equal to Accounts Payable Days Sales in Inventory 73 73 73 Days Sales in Receivables 45 45 Days Payables Outstanding 30 30 Capital Structure Decisions Dividend Payout Ratio 0% 10% 25% Planned LTD (year end) 500,000 600,000 700,000 Equity Account (Par + APIC) 2,750,000 2,750,000 2,600,000 40 30 2020 This fun exercise is an opportunity for you to show your understanding of financial projections and calculating cash flows. Please feel free to visit me during office hours to clarify material and check your work, but please don't email me your answers. Feel free to work with your classmates, but just know that relying too heavily on others' work might hurt you on future exams! Exercise: This is a common situation in the real world. Assume that you are an analyst covering a "recurring revenue" type firm. Recurring revenue firms typically earn revenues from customers over multiple periods. For instance, cable companies pay to acquire new customers, and the customers pay for services over a recurring time period. You will notice that this format is cost-driven, meaning that certain costs drive revenue! As an analyst, you want to know a) the financing needs for the firm, and b) how much the firm is worth. *Note that we would typically build this model on a monthly basis, but this exercise gets to the concept without you using Excel. As a "star analyst," you have used your skills to observe the financial metrics of the firm's competitors, industry trends and macroeconomic trends. Also, you have listened to and critiqued the firm's latest quarterly conference call. You incorporated all of this information to generate the following assumptions: Assumptions 2021 2022 ARPU - Average Revenue per User (annual, beginning customers) $ 1,200 $ 1,500 $ 1,800 Customer Assumptions Customer Acquisition Expense (per new customer) $ 400 $ 450 $ 450 Customer Churn (% of beginning customers who quit service) 10% 20% 20% Cost of Goods Sold per User (use beginning customers) $ 400 $ 500 $ 600 SG&A expense: Total Customer Acquisition Marketing Expense $ 120,000 $150,000 $ 180,000 Other SG&A expenses $ 80,000 $ 100,000 $100,000 Capital Expenditures (Capex) "Success-Based" Capex (capital expenditures / new customers 800 600 $ "Maintenance" Capex Equals Depreciation Expense Depreciation (% of lagged fixed assets) 10% 10% 10% Interest Expense (% of lagged NP and LTD) 10% 10% 10% Average Tax Rate 25% 25% 25% Required Cash Equal to Accounts Payable Days Sales in Inventory 73 73 73 Days Sales in Receivables 40 45 45 Days Payables Outstanding 30 30 30 Capital Structure Decisions Dividend Payout Ratio 10% 25% Planned LTD (year end) 500,000 600,000 700,000 Equity Account (Par+APIC) 2,750,000 2,750,000 2,600,000 500 0% A) Use the "Total Customer Acquisition Marketing Expense" and the per new customer acquisition cost to build the number of customers per year. Use the information above to complete the table below for gross additional customers and customer churn (beginning customers who quit service). I provided the ending customers of 2022 for you to check your work! Note, it is acceptable to have decimals for expected customer numbers). Projected 2021 2022 2020 650.00 Customer Numbers Beginning Customers Gross Additions Churn Ending Customers Actual 2019 500.00 200.00 (50.00) 650.00 1,233.07 B) Build the Income Statement projections. Projected 2021 2020 2022 Actual 2019 500,000 (150,000) 350,000 Income Statement Revenue Cost of Sales Gross Profits Operating Expenses Depreciation SG&A Total Opex Interest Expense Earnings Before Tax Tax Expense Net Income (180,000) (180,000) (360,000) (25,000) (35,000) 8,750 (26,250) 61,140 265,775 496,063 C) Build the Balance Sheet projections. 2022 Actual Projected Balance Sheet 2019 2020 2021 Assets Current Assets Required Cash 12,329 Inventory 30,000 Accounts Receivable 54,795 Total Current Assets 97,123 Equipment, net 2,000,000 Total Assets 2,097,123 Liabilities & Owners' Equity Current Liabilities Notes Payable 84,795 Accounts Payable 12,329 Total Current Liabilities 97,123 Long Term Debt 300,000 500,000 600,000 Total Liabilities 397,123 Common Stock Par and APIC 2,700,000 2,750,000 2,750,000 Retained Earnings (1,000,000) Total Stockholders' Equity 1,700,000 Total Liabilities & Owners' Equity 2,097,123 700,000 2,600,000 FIN 305 Homework 3 D) Build the Statement of Cash Flows projections. Make certain that your ending cash balance matches your Balance Sheet projections! Here, think about sources and uses of cash. I provided the ending cash balance for you to check your work! Projected 2021 2020 2022 Statement of Cash Flows Cash Flow from Operating Activities Net income Adjustments to Net Income Depreciation & Amortization Accounts receivable Inventory Accounts payable Net Cash from Operating Activities Cash Flow from Investing Activities Additions to equipment Net Cash from Investing Activities Cash Flow from Financing Activities Proceeds from notes payable Proceeds from Common stock Proceeds from long-term debt Dividends paid Net Cash from Financing Activities Net Increase in Cash Cash at the Beginning of the Period Cash at the End of the Period 12,329 51,353 FIN 30 Homework 3 E) Given the above assumptions, calculate the Cash Flow from Assets (CFFA) and the Cash Flow to Equity (CFE) for 2020, 2021 and 2022. F) We want to know the value of this projection plan to shareholders. Compute the Present Value of the Cash Flows to Equity during the Projected Period (assuming that they come at year's end). Assume that the required rate of return for equity holders is 20%. Hint: You should only have three cash flows here! FIN 305 Homework 3 G) If your management team believes that the enterprise value of the target firm will be 8 times the 2022 EBITDA value at the end of 2022, calculate the total equity value of this opportunity. Recall that eV = Market Value of Equity + Book Value of Debt - Excess Cash. Here, you can assume that you have no Excess Cash (all cash is required). Therefore, you simply multiply the 2022 EBITDA by 8, and then subtract the Book Value of Notes Payable and LTD to calculate the Market Value of Equity(Assume the same 20% discount rate, and don't forget to include the present value of the projected period calculated in part F). Questions: 1) What is the projected Depreciation & Amortization Expense for 2022? a) 200,000 b) 244,000 c) 220,000 2) What is the projected interest Expense for 2021? a) 56,634 b) 52,416 c) 50,000 3) What is the projected Retained Earnings for 2022? a) -327,615 b) 177,022 c) 1,822,978 4) What is the projected Equipment, net account in 2021? a) 2,001,400 b) 2,864,000 c) 2,440,000 5) What is the projected Accounts Payable account in 2022? a) 154,060 b) 51,353 c) 52,220 6) What is the projected proceeds from Common Stock in 2022 (difference between 2021 to 2022)? a) 150,000 b) 150,000 c) 2,600,000 7) What is the projected Dividends paid in 2021? a) 239,197 b) 265,775 c) 26,577 8) What is the projected Capex in 2022? a) 444,000 b) 2,640,000 c) 200,000 9) What is the projected investment in Inventory between 2021 and 2022 (hint: look at the change)? a) 624,800 b) 124,960 c) 36,460 10) What is the total equity value of this opportunity (your answer for part G above)? a) 4,205,465 b) 135,364 c) 7,033,134 2021 450 This fun exercise is an opportunity for you to show your understanding of financial projections and calculating cash flows. Please feel free to visit me during office hours to clarify material and check your work, but please don't email me your answers. Feel free to work with your classmates, but just know that relying too heavily on others' work might hurt you on future exams! Exercise: This is a common situation in the real world. Assume that you are an analyst covering a "recurring revenue" type firm. Recurring revenue firms typically earn revenues from customers over multiple periods. For instance, cable companies pay to acquire new customers, and the customers pay for services over a recurring time period. You will notice that this format is cost-driven, meaning that certain costs drive revenue! As an analyst, you want to know a) the financing needs for the firm, and b) how much the firm is worth. "Note that we would typically build this model on a monthly basis, but this exercise gets to the concept without you using Excel. As a "star analyst," you have used your skills to observe the financial metrics of the firm's competitors, industry trends and macroeconomic trends. Also, you have listened to and critiqued the firm's latest quarterly conference call. You incorporated all of this information to generate the following assumptions: Assumptions 2020 2022 ARPU - Average Revenue per User (annual, beginning customers) $ 1,200 $ 1,500 $ 1,800 Customer Assumptions Customer Acquisition Expense (per new customer) $ 400 $ 450 $ Customer Churn (% of beginning customers who quit service) 10% 20% 20% Cost of Goods Sold per User (use beginning customers) $ 400 $ 500 $ 600 SG&A expense: Total Customer Acquisition Marketing Expense $ 120,000 $ 150,000 $ 180,000 Other SG&A expenses $ 80,000 $ 100,000 $ 100,000 Capital Expenditures (Capex) "Success-Based" Capex (capital expenditures / new customer) $ 800 $ 600 $ 500 "Maintenance" Capex Equals Depreciation Expense Depreciation (% of lagged fixed assets) 10% 10% 10% Interest Expense (% of lagged NP and LTD) 10% 10% 10% Average Tax Rate 25% 25% 25% Required Cash Equal to Accounts Payable Days Sales in Inventory 73 73 73 Days Sales in Receivables 45 45 Days Payables Outstanding 30 30 Capital Structure Decisions Dividend Payout Ratio 0% 10% 25% Planned LTD (year end) 500,000 600,000 700,000 Equity Account (Par + APIC) 2,750,000 2,750,000 2,600,000 40 30