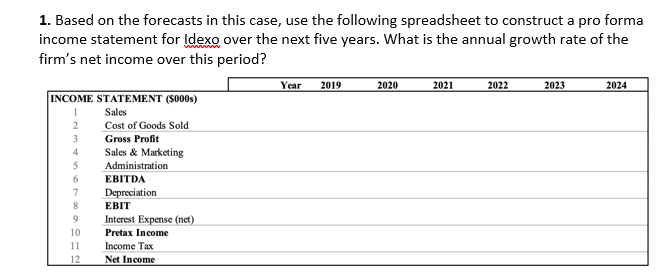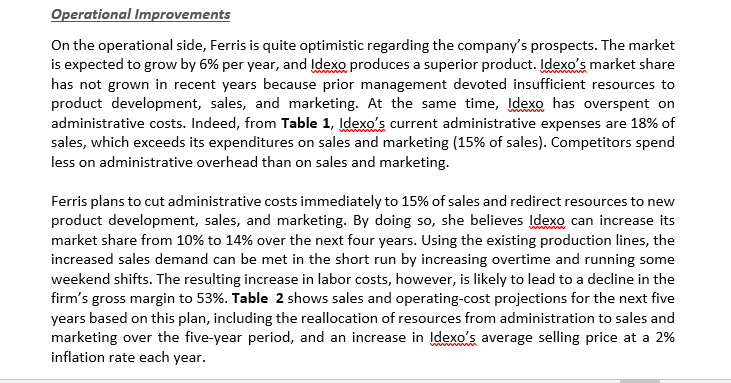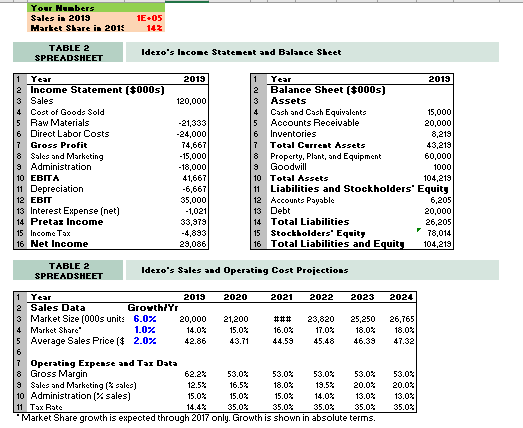


2021 2024 1. Based on the forecasts in this case, use the following spreadsheet to construct a pro forma income statement for Idexo over the next five years. What is the annual growth rate of the firm's net income over this period? Year 2019 2020 2022 2023 INCOME STATEMENT (5000) Sales Cost of Goods Sold Gross Profit Sales & Marketing Administration EBITDA Depreciation EBIT Interest Expense (net) Pretax Income Income Tax Net Income 1 2 3 4 5 6 7 8 9 10 11 12 Operational Improvements On the operational side, Ferris is quite optimistic regarding the company's prospects. The market is expected to grow by 6% per year, and Idexo produces a superior product. Idexo's market share has not grown in recent years because prior management devoted insufficient resources to product development, sales, and marketing. At the same time, Idexo has overspent on administrative costs. Indeed, from Table 1, Idexo's current administrative expenses are 18% of sales, which exceeds its expenditures on sales and marketing (15% of sales). Competitors spend less on administrative overhead than on sales and marketing. Ferris plans to cut administrative costs immediately to 15% of sales and redirect resources to new product development, sales, and marketing. By doing so, she believes Idexo can increase its market share from 10% to 14% over the next four years. Using the existing production lines, the increased sales demand can be met in the short run by increasing overtime and running some weekend shifts. The resulting increase in labor costs, however, is likely to lead to a decline in the firm's gross margin to 53%. Table 2 shows sales and operating-cost projections for the next five years based on this plan, including the reallocation of resources from administration to sales and marketing over the five-year period, and an increase in Idexo's average selling price at a 2% inflation rate each year. Your Humbers Sales in 2019 Hartet Share in 2013 1E+05 142 TABLE 2 SPREADSHEET Idero's lacone Statement and Balance Sheet 2019 120,000 1 Year 2 Income Statement ($0005) 3 Sales 4 Cost of Goods Sold 5 Raw Materials 6 Direct Labor Costs 7 Gross Profit 8 Sales and Marketing 9 Administration 10 EBITA 11 Depreciation 12 EBIT 13 Interest Expense (net) 14 Pretax Income 15 Income Tax 16 Net Income -21,333 -24,000 74,667 -15,000 -18,000 41,667 -6,667 35,000 -1,021 33,973 -4,893 29,086 1 Year 2019 2 Balance Sheet ($000s) 3 Assets 4 Cash and Cash Equivalents 15,000 5 Accounts Receivable 20,000 6 Inventories 8,219 Total Current Assets 43,219 8 Property, Plant, and Equipment 60,000 9 Goodwill 1000 10 Total Assets 104,219 11 Liabilities and Stockholders' Equity 12 Accounts Payable 6,205 13 Debt 14 Total Liabilities 26,205 15 Stockholders' Equity 78,014 16 Total Liabilities and Equity 104,219 20,000 TABLE 2 SPREADSHEET Idero's Sales and Operating Cost Projections 2024 26,765 18.0% 47.32 Year 2019 2020 2021 2022 2023 2 Sales Data Growth/YT 3 Market Size (000s units 6.0% 20,000 21,200 ### 23,820 25,250 Market Share 1.0% 14.0% 15.0% 16.0% 17.0% 18.0% 5 Average Sales Price ($ 2.0% 42.86 43.71 44.59 45.48 46.39 6 7 Operating Expense and Tar Data 8 Gross Margin 62.2% 53.0% 53.02 53.0% 53.0% 9 Sales and Marketing (sales) 12.5% 16.5% 18.0% 19.5% 20.02 10 Administration (% sales) 15.0% 15.0% 15.0% 14.0% 13.0% 11 Tax Rate 14.43 35.0% 35.02 35.0% 35.02 "Market Share growth is expected through 2017 only. Growth is shown in absolute terms. 53.0% 20.0% 13.0% 35.0% 2021 2024 1. Based on the forecasts in this case, use the following spreadsheet to construct a pro forma income statement for Idexo over the next five years. What is the annual growth rate of the firm's net income over this period? Year 2019 2020 2022 2023 INCOME STATEMENT (5000) Sales Cost of Goods Sold Gross Profit Sales & Marketing Administration EBITDA Depreciation EBIT Interest Expense (net) Pretax Income Income Tax Net Income 1 2 3 4 5 6 7 8 9 10 11 12 Operational Improvements On the operational side, Ferris is quite optimistic regarding the company's prospects. The market is expected to grow by 6% per year, and Idexo produces a superior product. Idexo's market share has not grown in recent years because prior management devoted insufficient resources to product development, sales, and marketing. At the same time, Idexo has overspent on administrative costs. Indeed, from Table 1, Idexo's current administrative expenses are 18% of sales, which exceeds its expenditures on sales and marketing (15% of sales). Competitors spend less on administrative overhead than on sales and marketing. Ferris plans to cut administrative costs immediately to 15% of sales and redirect resources to new product development, sales, and marketing. By doing so, she believes Idexo can increase its market share from 10% to 14% over the next four years. Using the existing production lines, the increased sales demand can be met in the short run by increasing overtime and running some weekend shifts. The resulting increase in labor costs, however, is likely to lead to a decline in the firm's gross margin to 53%. Table 2 shows sales and operating-cost projections for the next five years based on this plan, including the reallocation of resources from administration to sales and marketing over the five-year period, and an increase in Idexo's average selling price at a 2% inflation rate each year. Your Humbers Sales in 2019 Hartet Share in 2013 1E+05 142 TABLE 2 SPREADSHEET Idero's lacone Statement and Balance Sheet 2019 120,000 1 Year 2 Income Statement ($0005) 3 Sales 4 Cost of Goods Sold 5 Raw Materials 6 Direct Labor Costs 7 Gross Profit 8 Sales and Marketing 9 Administration 10 EBITA 11 Depreciation 12 EBIT 13 Interest Expense (net) 14 Pretax Income 15 Income Tax 16 Net Income -21,333 -24,000 74,667 -15,000 -18,000 41,667 -6,667 35,000 -1,021 33,973 -4,893 29,086 1 Year 2019 2 Balance Sheet ($000s) 3 Assets 4 Cash and Cash Equivalents 15,000 5 Accounts Receivable 20,000 6 Inventories 8,219 Total Current Assets 43,219 8 Property, Plant, and Equipment 60,000 9 Goodwill 1000 10 Total Assets 104,219 11 Liabilities and Stockholders' Equity 12 Accounts Payable 6,205 13 Debt 14 Total Liabilities 26,205 15 Stockholders' Equity 78,014 16 Total Liabilities and Equity 104,219 20,000 TABLE 2 SPREADSHEET Idero's Sales and Operating Cost Projections 2024 26,765 18.0% 47.32 Year 2019 2020 2021 2022 2023 2 Sales Data Growth/YT 3 Market Size (000s units 6.0% 20,000 21,200 ### 23,820 25,250 Market Share 1.0% 14.0% 15.0% 16.0% 17.0% 18.0% 5 Average Sales Price ($ 2.0% 42.86 43.71 44.59 45.48 46.39 6 7 Operating Expense and Tar Data 8 Gross Margin 62.2% 53.0% 53.02 53.0% 53.0% 9 Sales and Marketing (sales) 12.5% 16.5% 18.0% 19.5% 20.02 10 Administration (% sales) 15.0% 15.0% 15.0% 14.0% 13.0% 11 Tax Rate 14.43 35.0% 35.02 35.0% 35.02 "Market Share growth is expected through 2017 only. Growth is shown in absolute terms. 53.0% 20.0% 13.0% 35.0%


