Answered step by step
Verified Expert Solution
Question
1 Approved Answer
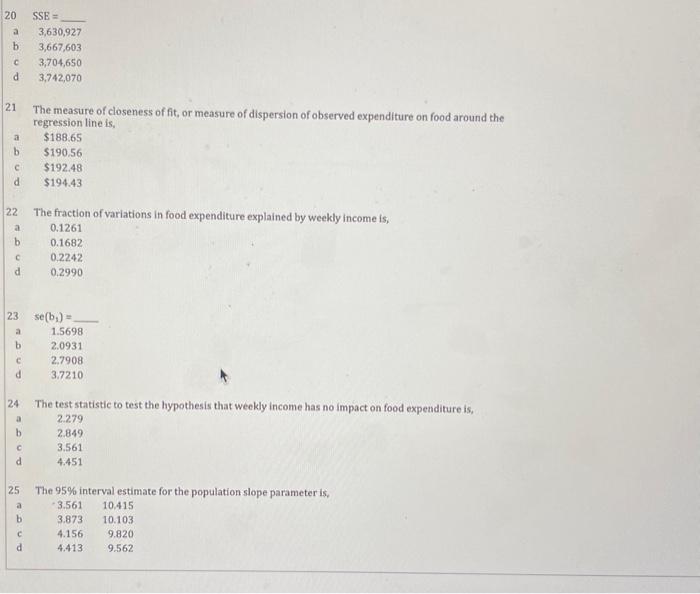
20-25 please!!! Questions 17-25 are related to the following The following table is the regression summary output for a model depicting the relationship between household
20-25 please!!!
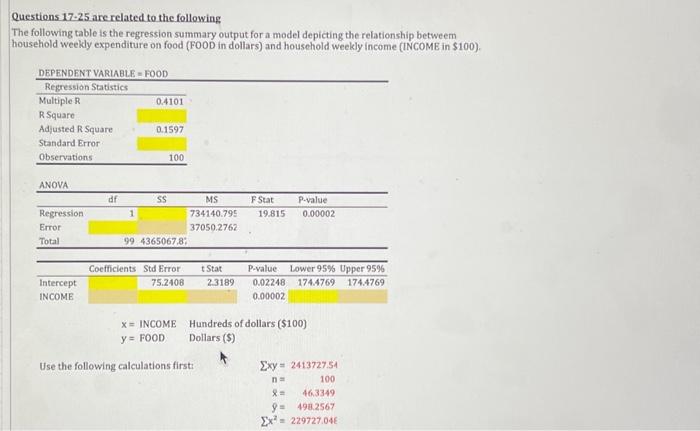
Questions 17-25 are related to the following The following table is the regression summary output for a model depicting the relationship between household weekly expenditure on food (FOOD in dollars) and household weekly income (INCOME in $100) DEPENDENT VARIABLE - FOOD Regression Statistics Multiple R 04101 R Square Adjusted R Square 0.1597 Standard Error Observations 100 ANOVA df SS MS F Stat P-value Regression 1 734140.795 19.815 0.00002 Error 37050.2762 Total 99 4365067.87 Coefficients Sto Error Stat P-value Lower 95% Upper 95% Intercept 75.2408 23189 0.02248 174.4769 174.4769 INCOME 0.00002 x= INCOME Hundreds of dollars ($100) y = FOOD Dollars ($) Use the following calculations first Exy = 2413727.54 100 46.3349 9= 498.2567 Ex = 229727.04620 SSE = 3,630,927 3,667,603 3,704,650 3,742,070 21 The measure of closeness of fit, or measure of dispersion of observed expenditure on food around the regression line is, $188.65 $190.56 $192.48 $194.43 22 The fraction of variations In food expenditure explained by weekly income is, 0.1261 0.1682 0.2242 0.2990 23 se(bj) = 1.5698 2.0931 2.7908 3/7210 24 The test statistic to test the hypothesis that weekly income has no impact on food expenditure is, 2.279 2.849 3.561 4:451 25 The 95% interval estimate for the population slope parameter is, 3.561 10,415 3.873 10.103 4.156 9.820 4.413 9.562Step by Step Solution
There are 3 Steps involved in it
Step: 1
Get Instant Access to Expert-Tailored Solutions
See step-by-step solutions with expert insights and AI powered tools for academic success
Step: 2
Step: 3
Ace Your Homework with AI
Get the answers you need in no time with our AI-driven, step-by-step assistance
Get Started