

Answered step by step
Verified Expert Solution
Question
1 Approved Answer
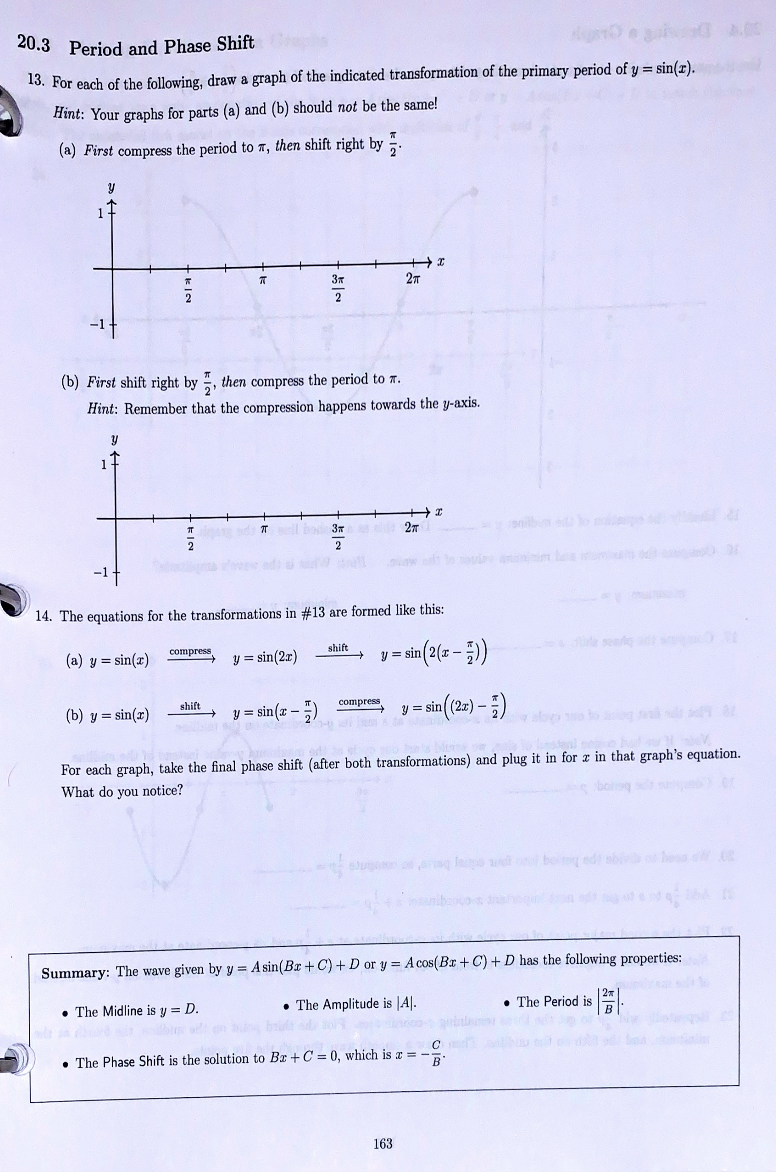
20.3 Period and Phase Shift 13. For each of the following, draw a graph of the indicated transformation of the primary period of y =
Step by Step Solution
There are 3 Steps involved in it
Step: 1

Get Instant Access to Expert-Tailored Solutions
See step-by-step solutions with expert insights and AI powered tools for academic success
Step: 2

Step: 3
Ace Your Homework with AI
Get the answers you need in no time with our AI-driven, step-by-step assistance
Get Started
An Introduction to Analysis
Authors: William R. Wade
4th edition
132296381, 978-0132296380