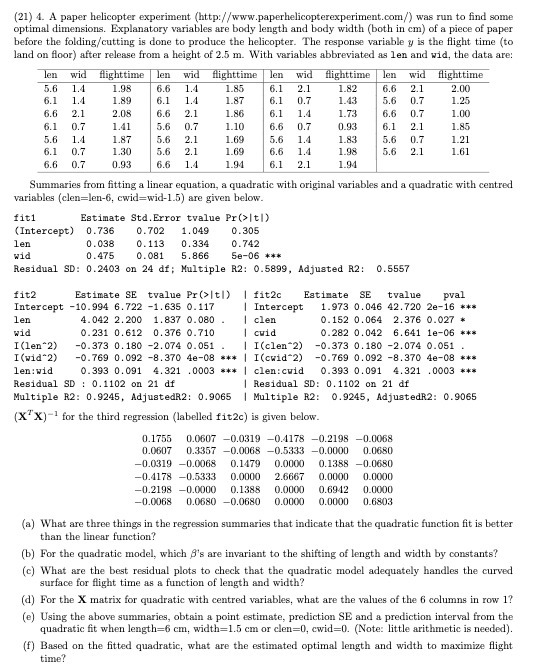
(21) 4. A paper helicopter experiment (http://www.paperhelicopterexperiment.com/) was run to find some optimal dimensions. Explanatory variables are body length and body width (both in cm) of a piece of paper before the folding/cutting is done to produce the helicopter. The response variable y is the flight time (to land on floor) after release from a height of 2.5 m. With variables abbreviated as len and wid, the data are: wid flighttime len wid flighttime len wid flighttime len wid flighttime 5.6 1.4 1.98 6.6 1.4 1.85 6.1 2.1 1.82 6.6 2.1 2.00 6.1 1.4 1.89 6.1 1.4 1.87 6.1 0.7 1.43 5.6 0.7 1.25 6.6 2.1 2.08 6.6 2.1 1.86 6.1 1.4 1.73 6.6 0.7 1.00 6.1 0.7 1.41 5.6 0.7 1.10 6.6 0.7 0.93 6.1 2.1 1.85 5.6 1.4 1.87 5.6 2.1 1.69 5.6 1.4 1.83 5.6 0.7 1.21 6.1 0.7 1.30 5.6 2.1 1.69 6.6 1.4 1.98 5.6 2.1 1.61 6.6 0.7 0.93 6.6 1.4 1.94 6.1 2.1 1.94 Summaries from fitting a linear equation, a quadratic with original variables and a quadratic with centred variables (clen=len-6, cwid=wid-1.5) are given below. fiti Estimate Std. Error tvalue Pr(>Itl) (Intercept) 0.736 0.702 1. 049 0.305 len 0.038 0. 113 0. 334 0.742 wid 0. 475 0. 081 5.866 Se-06 *#* Residual SD: 0.2403 on 24 df; Multiple R2: 0.5899, Adjusted R2: 0.5557 fit2 Estimate SE tvalue Pr(>|t[) fit2c Estimate SE tvalue pval Intercept -10.994 6.722 -1. 635 0.117 Intercept 1.973 0. 046 42.720 2e-16 **s len 4. 042 2. 200 1.837 0. 080 clen 0. 152 0. 064 2.376 0.027 * wid 0. 231 0. 612 0. 376 0.710 cuid 0.282 0. 042 6.641 le-06 * *s I (len*2) -0.373 0. 180 -2. 074 0. 051 I(clen*2) -0.373 0. 180 -2.074 0.051 I (wid 2) -0.769 0.092 -8.370 4e-08 *# I (cwid*2) -0.769 0.092 -8.370 4e-08 * *s len : wid 0.393 0. 091 4. 321 . 0003 *# | clen:cuid 0.393 0. 091 4.321 .0003 **= Residual SD : 0. 1102 on 21 df Residual SD: 0. 1102 on 21 df Multiple R2: 0.9245, AdjustedR2: 0.9065 | Multiple R2: 0.9245, AdjustedR2: 0.9065 (X X) for the third regression (labelled fit2c) is given below. 0.1755 0.0607 -0.0319 -0.4178 -0.2198 -0.0068 0.0607 0.3357 -0.0068 -0.5333 -0.0000 0.0680 -0.0319 -0.0068 0.1479 0.0000 0.1388 -0.0680 -0.4178 -0.5333 0.0000 2.6667 0.0000 0.0000 -0.2198 -0.0000 0.1388 0.0000 0.6942 0.0000 -0.0068 0.0680 -0.0680 0.0000 0.0000 0.6803 (a) What are three things in the regression summaries that indicate that the quadratic function fit is better than the linear function? (b) For the quadratic model, which A's are invariant to the shifting of length and width by constants? (c) What are the best residual plots to check that the quadratic model adequately handles the curved surface for flight time as a function of length and width? (d) For the X matrix for quadratic with centred variables, what are the values of the 6 columns in row 1? (e) Using the above summaries, obtain a point estimate, prediction SE and a prediction interval from the quadratic fit when length=6 cm, width=1.5 cm or clen=0, cwid=0. (Note: little arithmetic is needed). (f) Based on the fitted quadratic, what are the estimated optimal length and width to maximize flight time