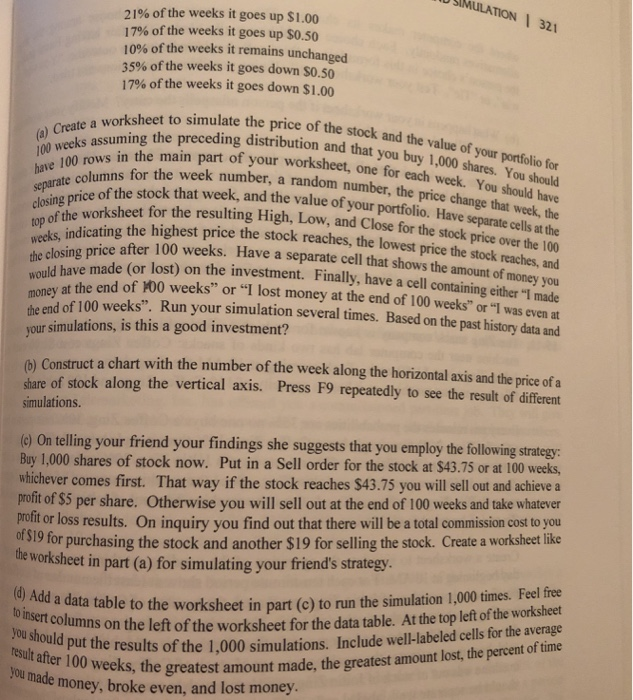
21% of the weeks it goes up $1.00 17% of the weeks it goes up $0.50 10% of the weeks it remains unchanged 35% of the weeks it goes down $0.50 17% of the weeks it goes down $1.00 worksheet to simulate the price of the stock and the value of eeks assuming the preceding distribution and that you buy 1 e 100 r rows in the main part of your worksheet, one for each week. You should have m number, the price change that week, the have 100 columns for the week number, a random rathe stock that week, and the value of your portfol lue of your portfolio. Have separate cells at the for the resulting High, Low, and Close for the stock price over the 100 price o closing t0p indicating the highest price the stock reaches, the lowest worksheet price the stock reaches, and amount of money you g either "I made closing price after 100 weeks. Have a separate cell that shows the anm have made (or lost) on the investment. Finally, have a cell containin would oney at the end of H00 weeks" or "I lost money at the end of 100 weeks" or of 100 weeks". Run your simulation several times. Based on the past history data and your simulations, is this a good investment? 0) Construct a chart with the number of the week along the horizontal axis and the price of a share of stock along the vertical axis. Press F9 repeatedly to see the result of different simulations On telling your friend your findings she suggests that you employ the following strategy Buy 1,000 shares of stock now. Put in a Sell order for the stock at $43.75 or at 100 weeks, whichever comes first. That way if the stock reaches $43.75 you will sell out and achieve a profit of $5 per share. Otherwise you will sell out at the end of 100 weeks and take whatever protit or loss results. On inquiry you find out that there will be a total commission cost to you S19 for purchasing the stock and another $19 for selling the stock. Create a workshet like orksheet in part (a) for simulating your friend's strategy ns on the left of the worksheet for the data table. At the top left of the worksheet or the results of the 1,000 simulations. Include well-labeled cells for the average eeks, the greatest amount made, the greatest amount lost, the percent of time a data table to the worksheet in part (c) to run the simulation 1,000 times. Feel you should put results made money, broke even, and lost money 21% of the weeks it goes up $1.00 17% of the weeks it goes up $0.50 10% of the weeks it remains unchanged 35% of the weeks it goes down $0.50 17% of the weeks it goes down $1.00 worksheet to simulate the price of the stock and the value of eeks assuming the preceding distribution and that you buy 1 e 100 r rows in the main part of your worksheet, one for each week. You should have m number, the price change that week, the have 100 columns for the week number, a random rathe stock that week, and the value of your portfol lue of your portfolio. Have separate cells at the for the resulting High, Low, and Close for the stock price over the 100 price o closing t0p indicating the highest price the stock reaches, the lowest worksheet price the stock reaches, and amount of money you g either "I made closing price after 100 weeks. Have a separate cell that shows the anm have made (or lost) on the investment. Finally, have a cell containin would oney at the end of H00 weeks" or "I lost money at the end of 100 weeks" or of 100 weeks". Run your simulation several times. Based on the past history data and your simulations, is this a good investment? 0) Construct a chart with the number of the week along the horizontal axis and the price of a share of stock along the vertical axis. Press F9 repeatedly to see the result of different simulations On telling your friend your findings she suggests that you employ the following strategy Buy 1,000 shares of stock now. Put in a Sell order for the stock at $43.75 or at 100 weeks, whichever comes first. That way if the stock reaches $43.75 you will sell out and achieve a profit of $5 per share. Otherwise you will sell out at the end of 100 weeks and take whatever protit or loss results. On inquiry you find out that there will be a total commission cost to you S19 for purchasing the stock and another $19 for selling the stock. Create a workshet like orksheet in part (a) for simulating your friend's strategy ns on the left of the worksheet for the data table. At the top left of the worksheet or the results of the 1,000 simulations. Include well-labeled cells for the average eeks, the greatest amount made, the greatest amount lost, the percent of time a data table to the worksheet in part (c) to run the simulation 1,000 times. Feel you should put results made money, broke even, and lost money


