

Question
2.11. Using the phase diagram to analyze the impact of an anticipated change. Consider the policy described in Problem 2.10, but suppose that instead of
2.11. Using the phase diagram to analyze the impact of an anticipated change. Consider the policy described in Problem 2.10, but suppose that instead of announcing and implementing the tax at time 0, the government announces at time 0 than at some later time, time t1, and investment income will begin to be taxed at rate .
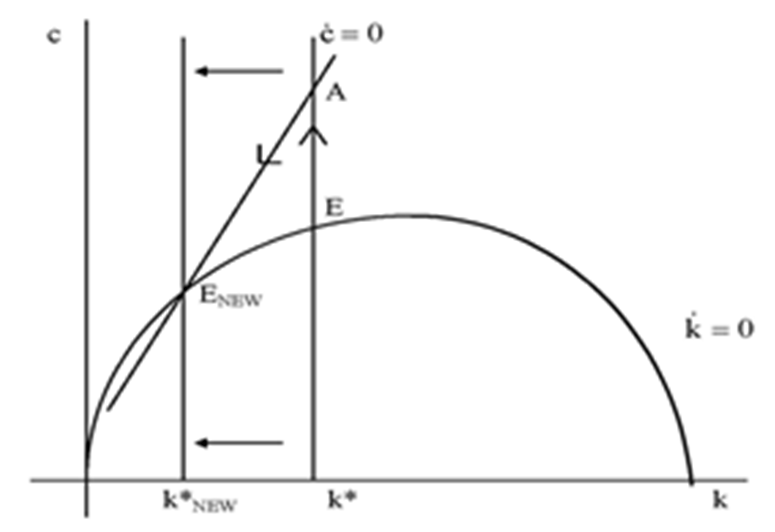
(a) Draw the phase diagram showing the dynamics of c and k after time t1.
(b) Can c change discontinuously at time t1? Why or why not?
(c) Draw the phase diagram showing the dynamics of c and k before t1
(d) In light of your answers to parts (a), (b), and (c), what must c do at time 0?
(e) Summarize your results by sketching the paths of c and k as functions of time.
E ENEW k=0 KEW K E ENEW k=0 KEW KStep by Step Solution
There are 3 Steps involved in it
Step: 1

Get Instant Access to Expert-Tailored Solutions
See step-by-step solutions with expert insights and AI powered tools for academic success
Step: 2

Step: 3
Ace Your Homework with AI
Get the answers you need in no time with our AI-driven, step-by-step assistance
Get Started
Essentials Of Applied Econometrics
Authors: Aaron D Smith, J Edward Taylor
1st Edition
0520288335, 9780520288331