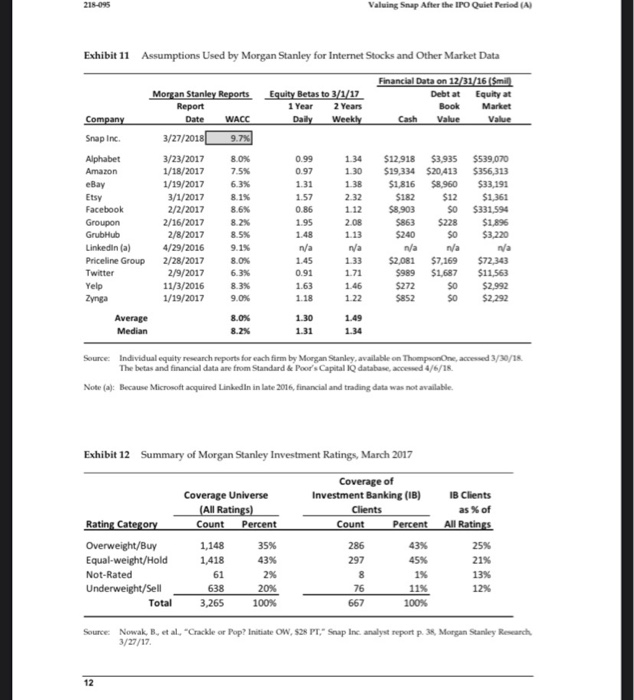
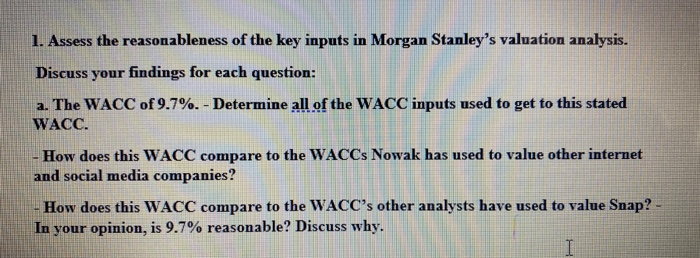
218-095 Valuing Snap After the IPO Quiet Period (A) Exhibit 11 Assumptions Used by Morgan Stanley for Internet Stocks and Other Market Data Financial Data on 12/31/16 (Smil) Morgan Stanley Reports Equity Betas to 3/1/17 Debt at Equity at Report 1 Year 2 Years Book Market Company Date WACC Daily Weekly Cash Value Value Snap Inc. 3/27/2018 9.7% Alphabet 3/23/2017 8.0% 0.99 1 34 $12,918 $3,935 $539,070 Amazon 1/18/2017 7.5% 0.97 1 30 $19,334 $20,413 $356,313 eBay 1/19/2017 6.3% 1.31 1.38 $1,816 $8.960 $33,191 Etsy 3/1/2017 8.1% 1.57 2.32 $182 $12 $1,361 Facebook 2/2/2017 8.6% 0.86 1.12 $8.903 SO $331,594 Groupon 2/16/2017 8.2% 1.95 2.08 $863 $228 $1,896 GrubHub 2/8/2017 8.5% 1.13 $240 SO $3.220 Linkedin (a) 4/29/2016 9.1% n/a nya n/a n/a wa Priceline Group 2/28/2017 8.0% 1.45 1.33 $2,081 $7,169 $72 343 Twitter 2/9/2017 6.3% 0.91 1.71 $989 $1,687 $11,563 11/3/2016 8.3% 1.63 1.46 $272 SO $2,992 Zynga 1/19/2017 9.0% 1.18 1.22 $852 $0 $2,292 Average 8.0% 1.30 1.49 Median 8.2% 1.31 1.48 Yelp Source: Individual equity research reports for each firm by Morgan Stanley, available on ThompsonOne, accessed 3/30/18 The bets and financial data are from Standard & Poor's Capital IQ database, accessed 4/6/18 Note (a): Because Microsoft acquired Linkedin in late 2016, financial and trading data was not available. Exhibit 12 Summary of Morgan Stanley Investment Ratings, March 2017 Coverage of Coverage Universe Investment Banking (1) IB Clients (All Ratings) Clients as of Rating Category Count Percent Count Percent All Ratings Overweight/Buy 1,148 35% 286 43% 25% Equal-weight/Hold 1,418 43% 297 45% 21% Not-Rated 61 2% 1% 13% Underweight/Sell 638 20% 76 11% 12% Total 3,265 100% 667 100% Source: Nowak, B., et al., "Crackle or Pop? Initiate OW,828 PT" Snap Inc. analyst report p. 38, Morgan Stanley Research 3/27/17 8 12 1. Assess the reasonableness of the key inputs in Morgan Stanley's valuation analysis. Discuss your findings for each question: a. The WACC of 9.7%. - Determine all of the WACC inputs used to get to this stated WACC. How does this WACC compare to the WACCs Nowak has used to value other internet and social media companies? How does this WACC compare to the WACC's other analysts have used to value Snap? - In your opinion, is 9.7% reasonable? Discuss why. I 218-095 Valuing Snap After the IPO Quiet Period (A) Exhibit 11 Assumptions Used by Morgan Stanley for Internet Stocks and Other Market Data Financial Data on 12/31/16 (Smil) Morgan Stanley Reports Equity Betas to 3/1/17 Debt at Equity at Report 1 Year 2 Years Book Market Company Date WACC Daily Weekly Cash Value Value Snap Inc. 3/27/2018 9.7% Alphabet 3/23/2017 8.0% 0.99 1 34 $12,918 $3,935 $539,070 Amazon 1/18/2017 7.5% 0.97 1 30 $19,334 $20,413 $356,313 eBay 1/19/2017 6.3% 1.31 1.38 $1,816 $8.960 $33,191 Etsy 3/1/2017 8.1% 1.57 2.32 $182 $12 $1,361 Facebook 2/2/2017 8.6% 0.86 1.12 $8.903 SO $331,594 Groupon 2/16/2017 8.2% 1.95 2.08 $863 $228 $1,896 GrubHub 2/8/2017 8.5% 1.13 $240 SO $3.220 Linkedin (a) 4/29/2016 9.1% n/a nya n/a n/a wa Priceline Group 2/28/2017 8.0% 1.45 1.33 $2,081 $7,169 $72 343 Twitter 2/9/2017 6.3% 0.91 1.71 $989 $1,687 $11,563 11/3/2016 8.3% 1.63 1.46 $272 SO $2,992 Zynga 1/19/2017 9.0% 1.18 1.22 $852 $0 $2,292 Average 8.0% 1.30 1.49 Median 8.2% 1.31 1.48 Yelp Source: Individual equity research reports for each firm by Morgan Stanley, available on ThompsonOne, accessed 3/30/18 The bets and financial data are from Standard & Poor's Capital IQ database, accessed 4/6/18 Note (a): Because Microsoft acquired Linkedin in late 2016, financial and trading data was not available. Exhibit 12 Summary of Morgan Stanley Investment Ratings, March 2017 Coverage of Coverage Universe Investment Banking (1) IB Clients (All Ratings) Clients as of Rating Category Count Percent Count Percent All Ratings Overweight/Buy 1,148 35% 286 43% 25% Equal-weight/Hold 1,418 43% 297 45% 21% Not-Rated 61 2% 1% 13% Underweight/Sell 638 20% 76 11% 12% Total 3,265 100% 667 100% Source: Nowak, B., et al., "Crackle or Pop? Initiate OW,828 PT" Snap Inc. analyst report p. 38, Morgan Stanley Research 3/27/17 8 12 1. Assess the reasonableness of the key inputs in Morgan Stanley's valuation analysis. Discuss your findings for each question: a. The WACC of 9.7%. - Determine all of the WACC inputs used to get to this stated WACC. How does this WACC compare to the WACCs Nowak has used to value other internet and social media companies? How does this WACC compare to the WACC's other analysts have used to value Snap? - In your opinion, is 9.7% reasonable? Discuss why