

Answered step by step
Verified Expert Solution
Question
1 Approved Answer
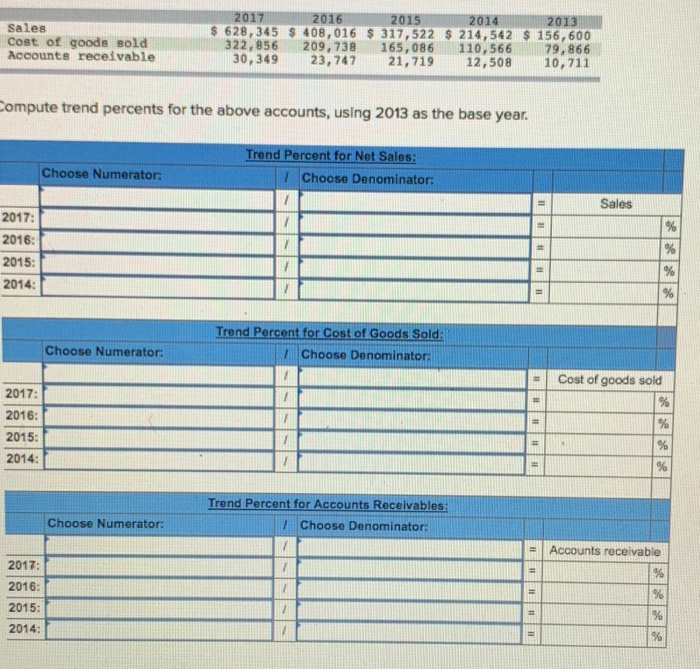
22 20172 2016201520142013 S 628,345 $ 408,016 $317,522 $ 214,542 $ 156,600 322,856 209,738 165,086 110,56679,866 30, 349 23,747 21,719 12,508 10,711 Sales cost of
22
Step by Step Solution
There are 3 Steps involved in it
Step: 1

Get Instant Access to Expert-Tailored Solutions
See step-by-step solutions with expert insights and AI powered tools for academic success
Step: 2

Step: 3
Ace Your Homework with AI
Get the answers you need in no time with our AI-driven, step-by-step assistance
Get Started
Financial Accounting A Practical Version
Authors: Abanis Turyahebwa ,Kasozi Geoffrey
1st Edition
6205489481, 978-6205489482