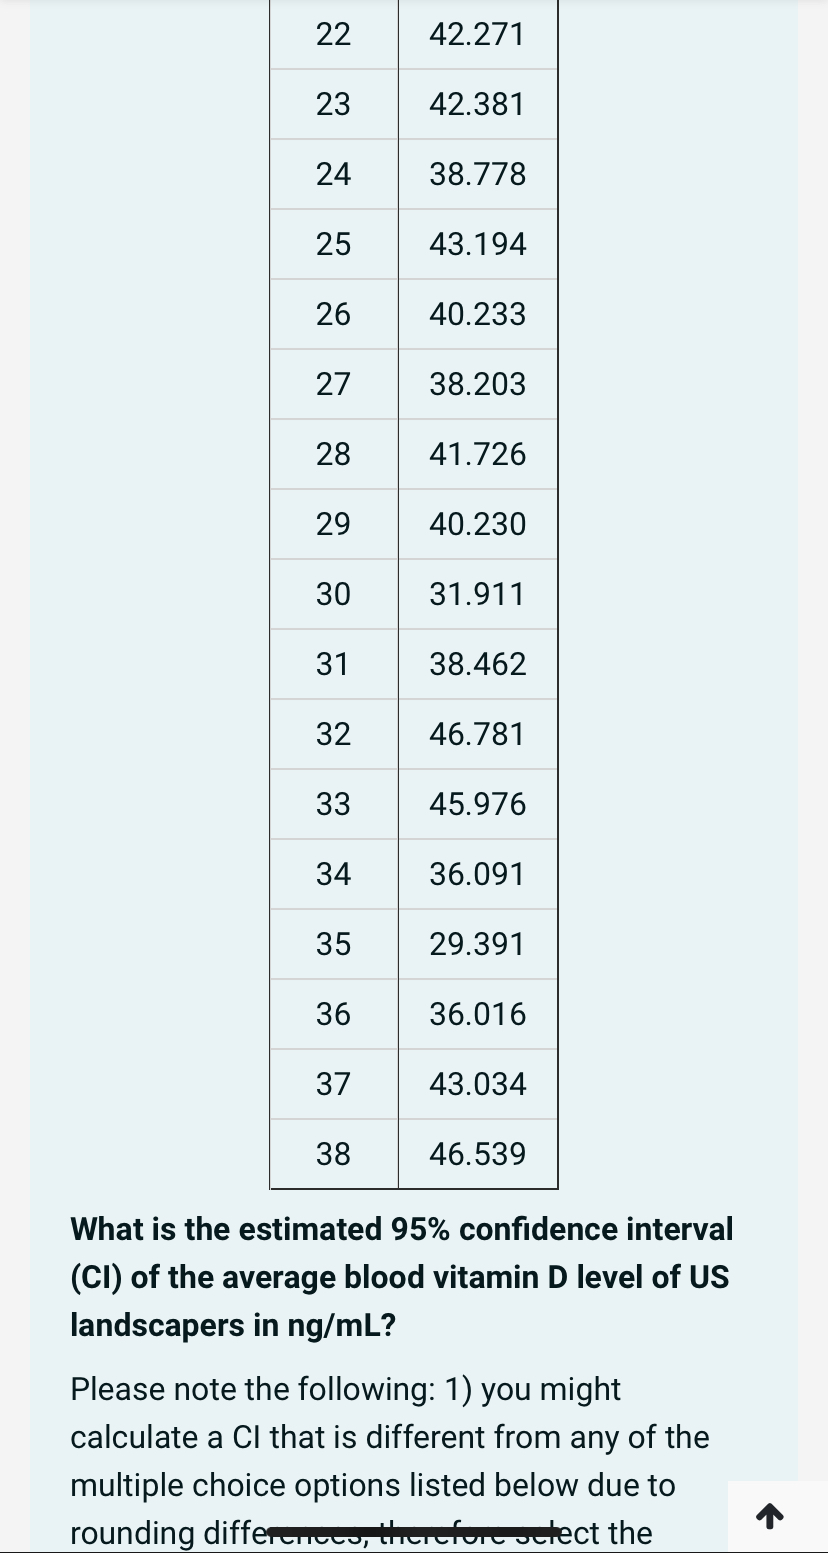
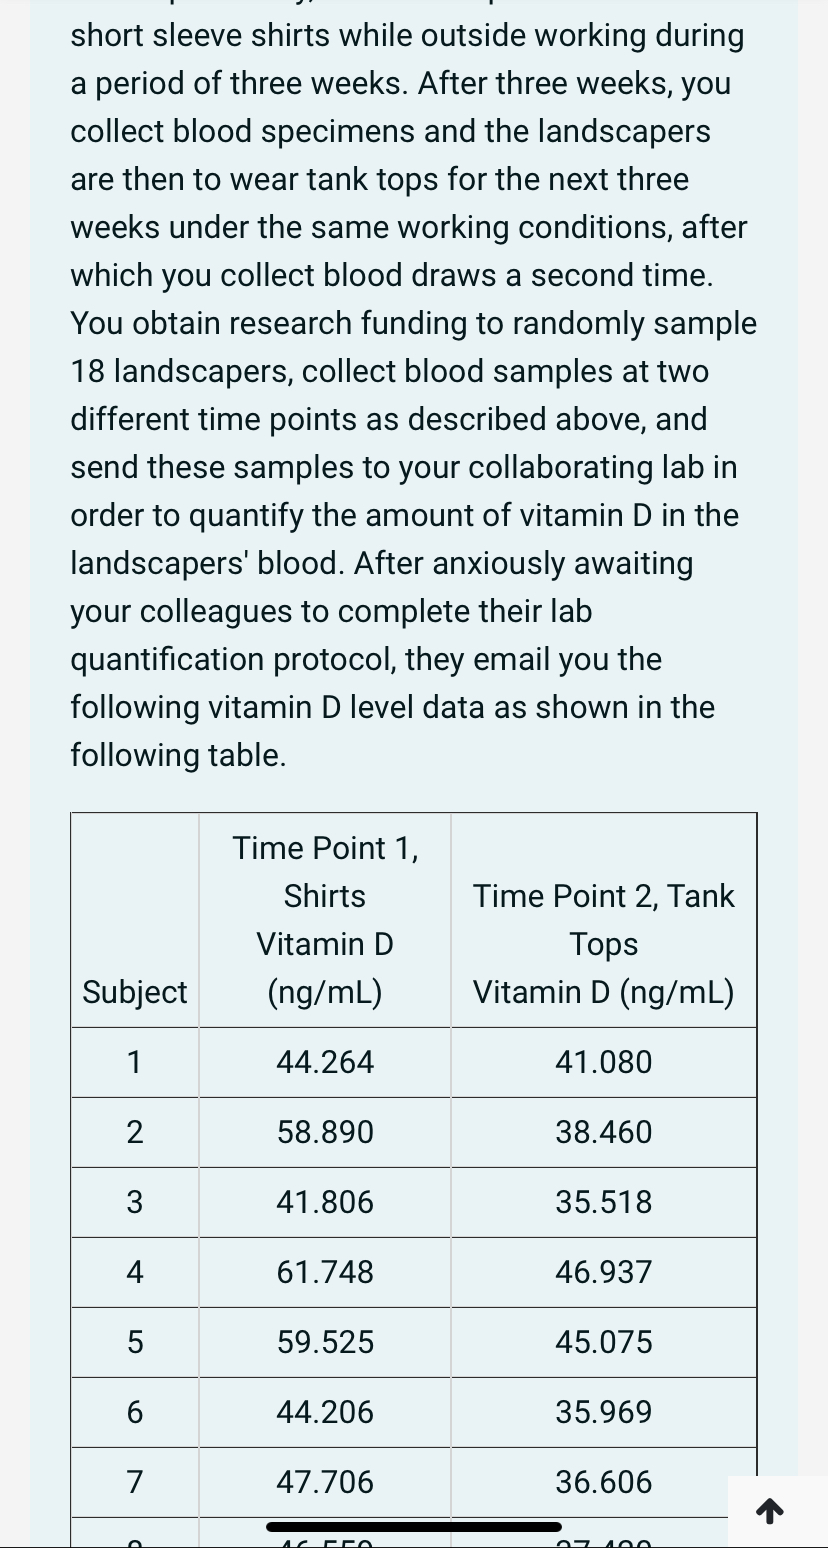
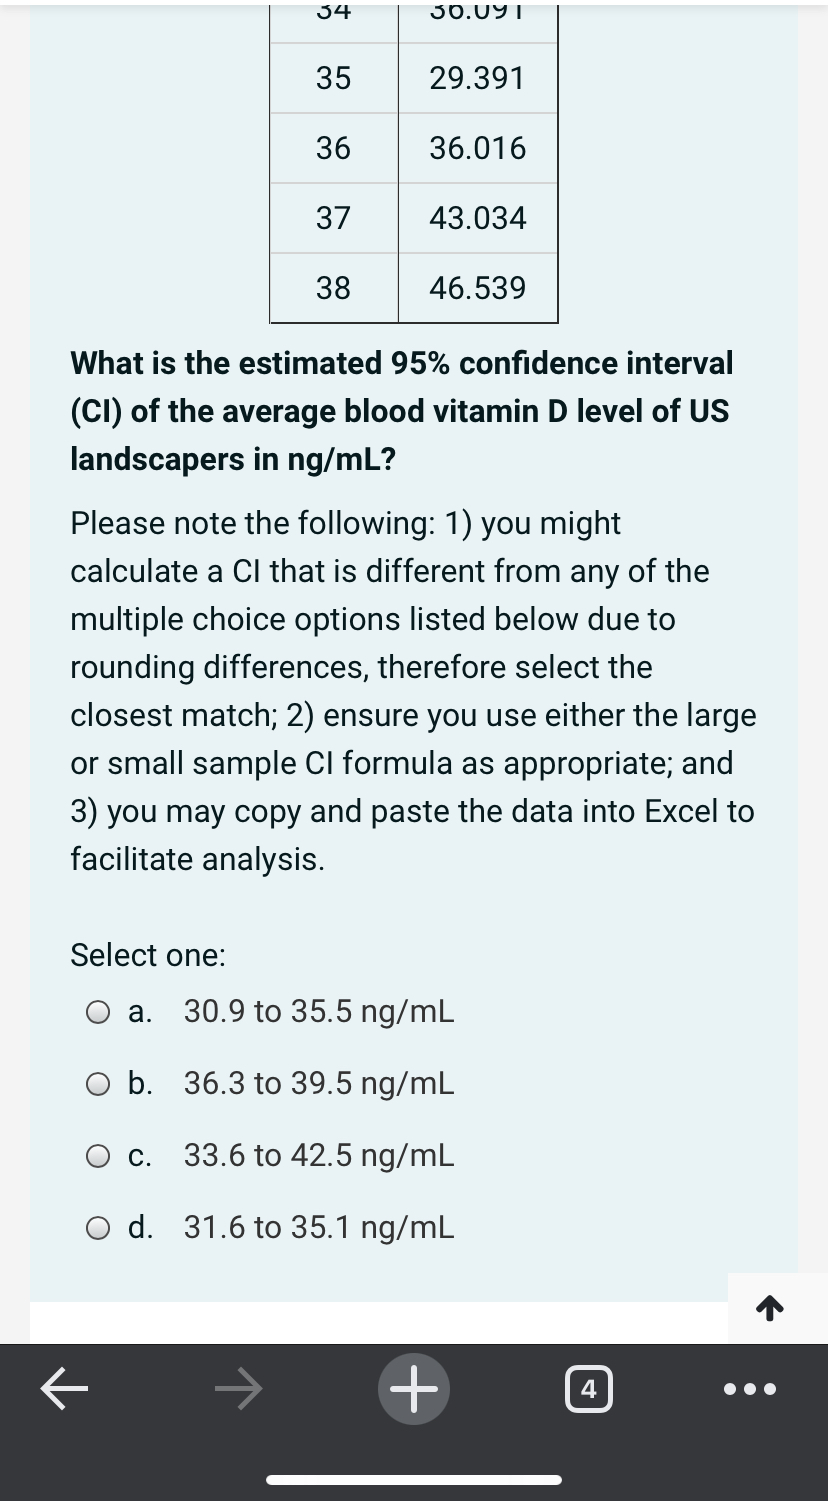
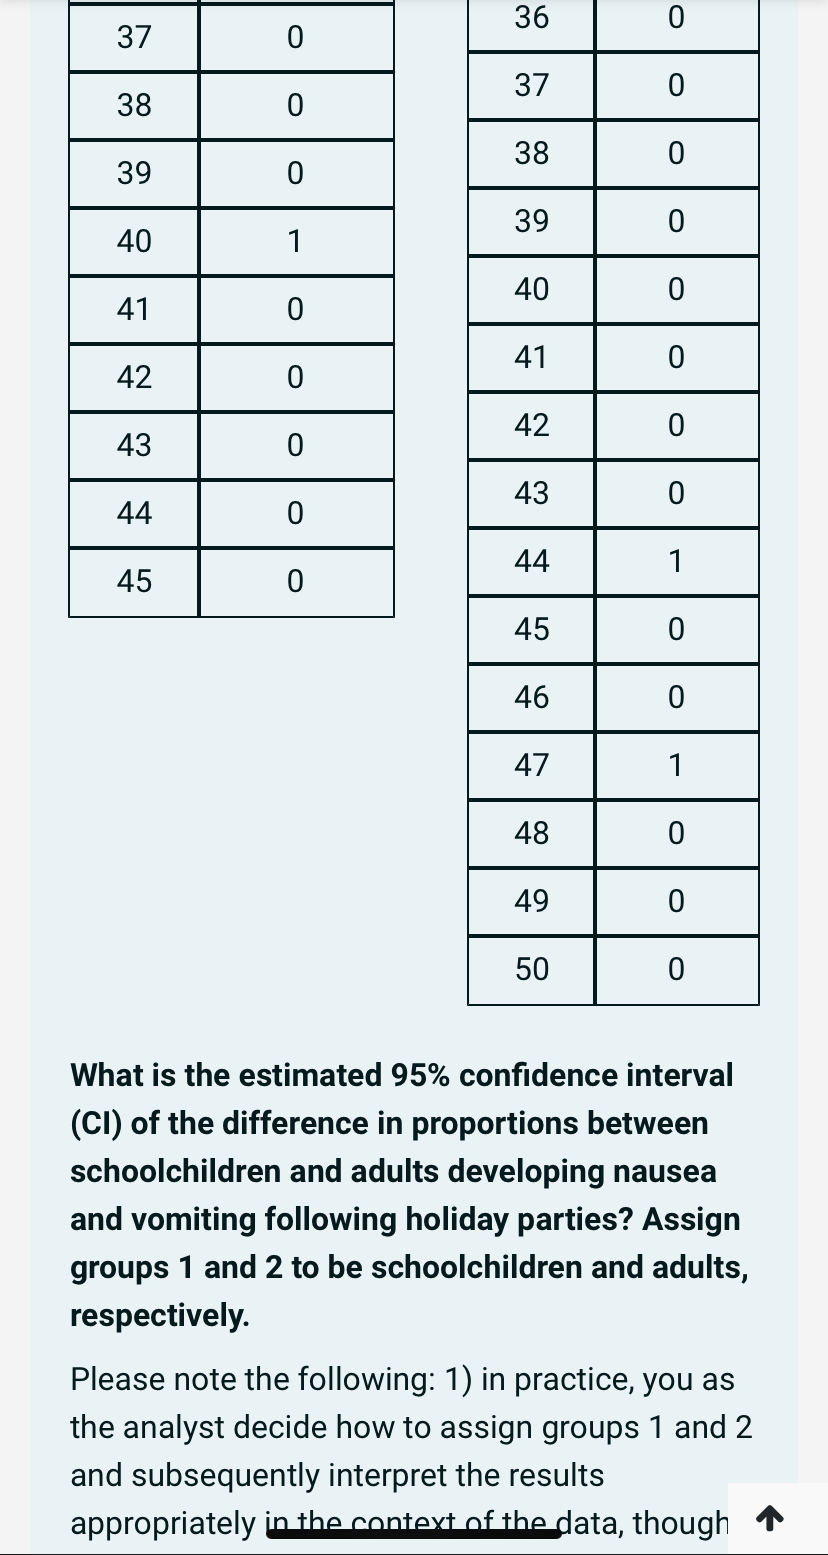
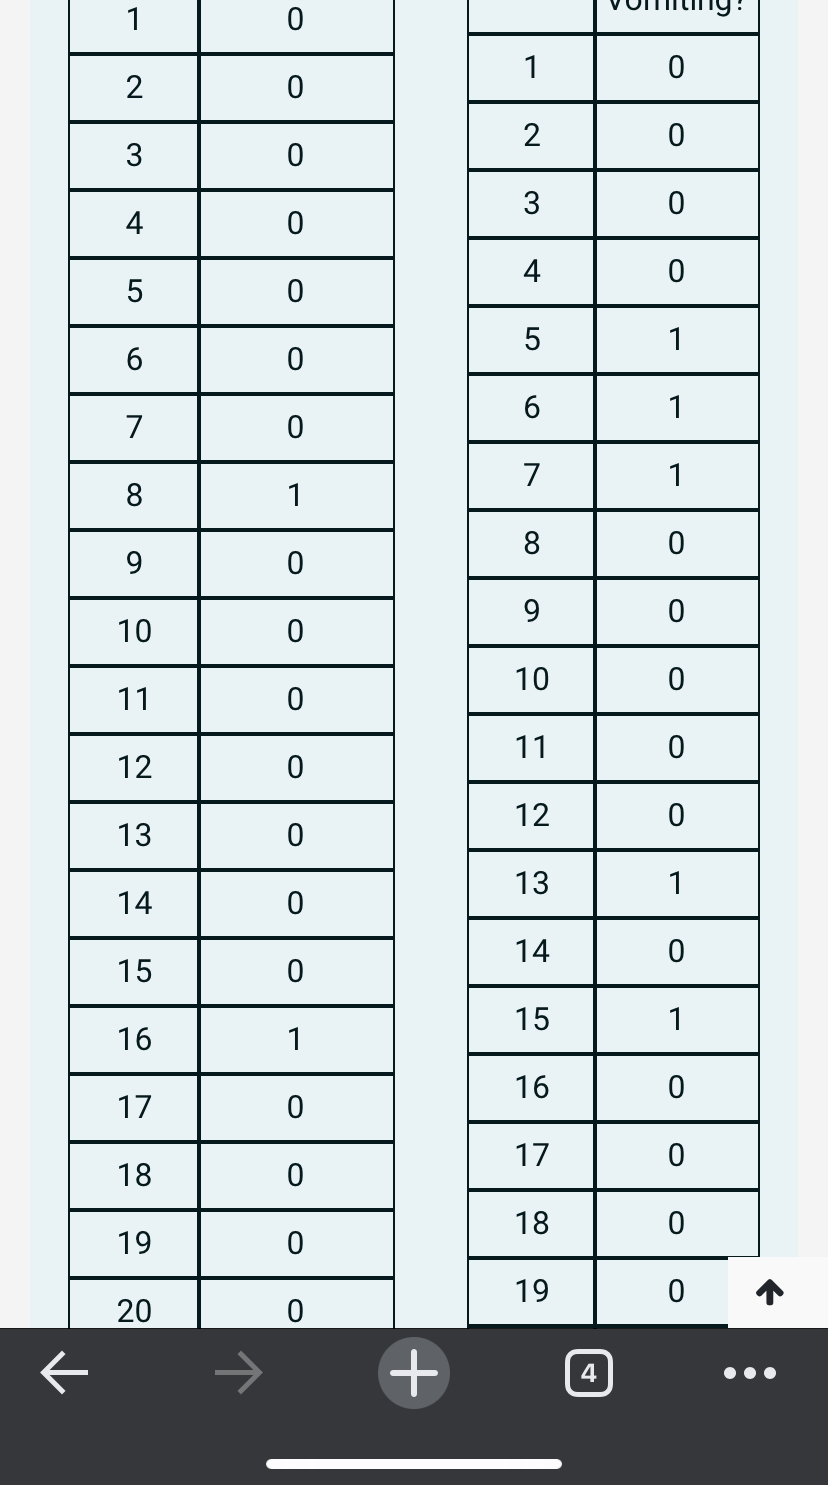
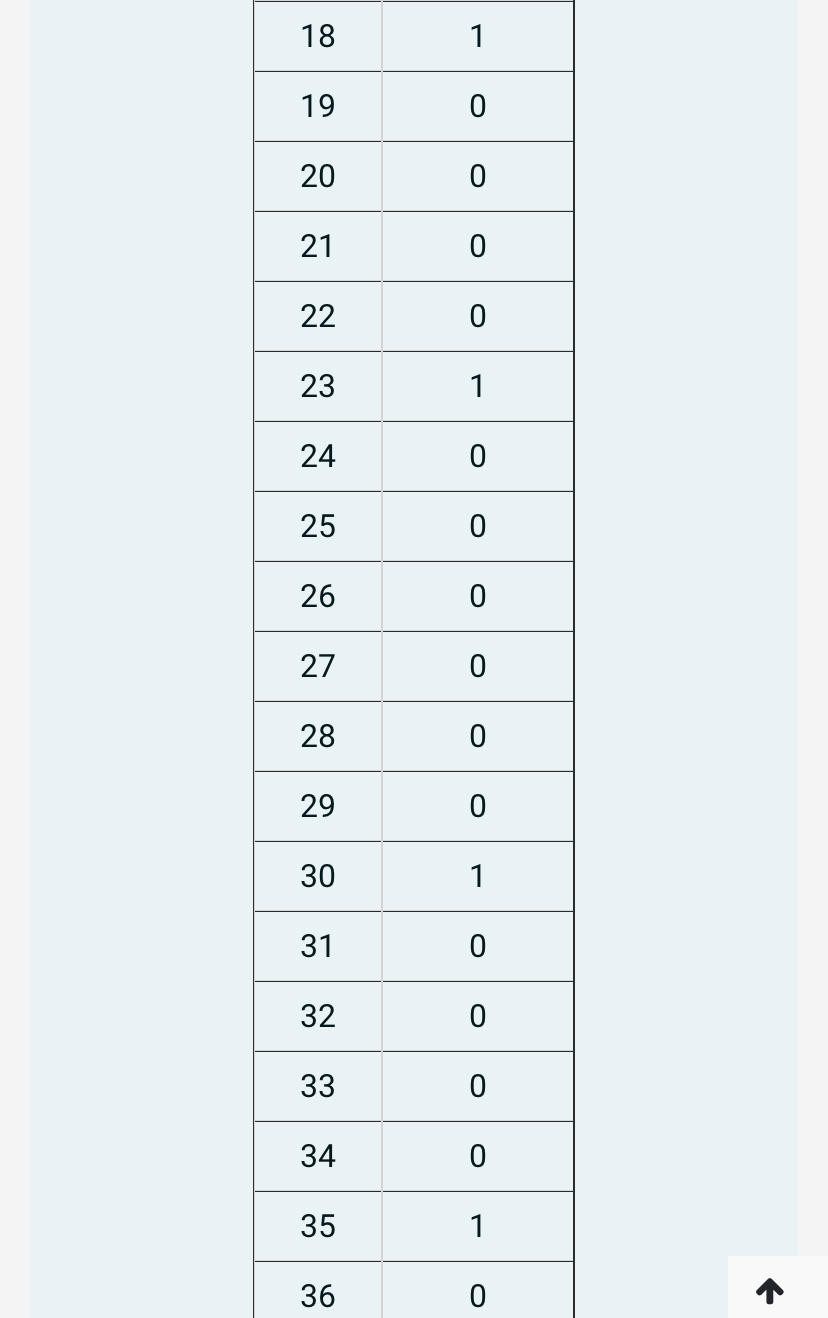
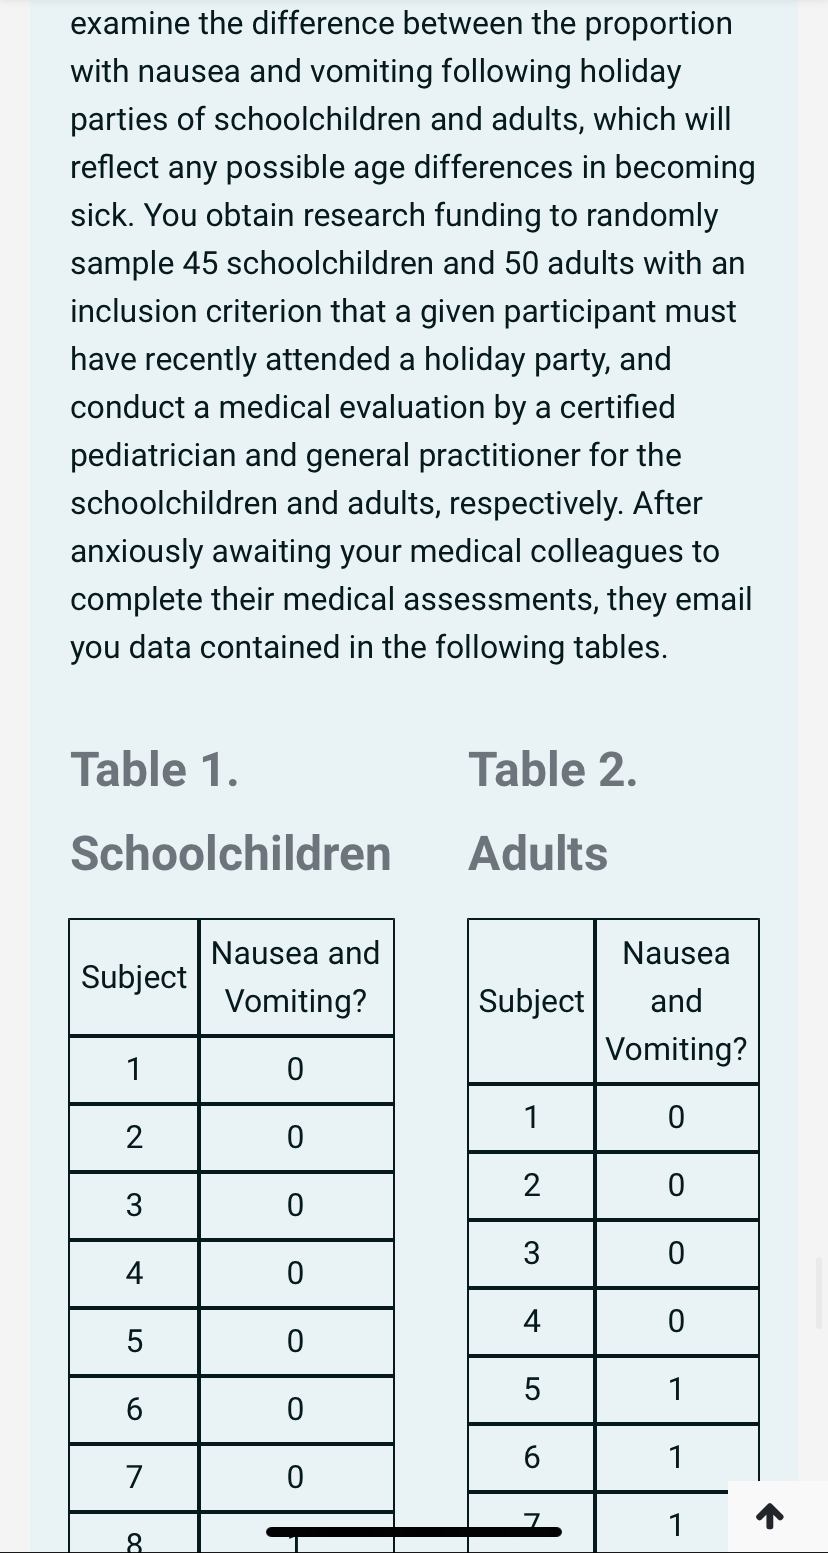
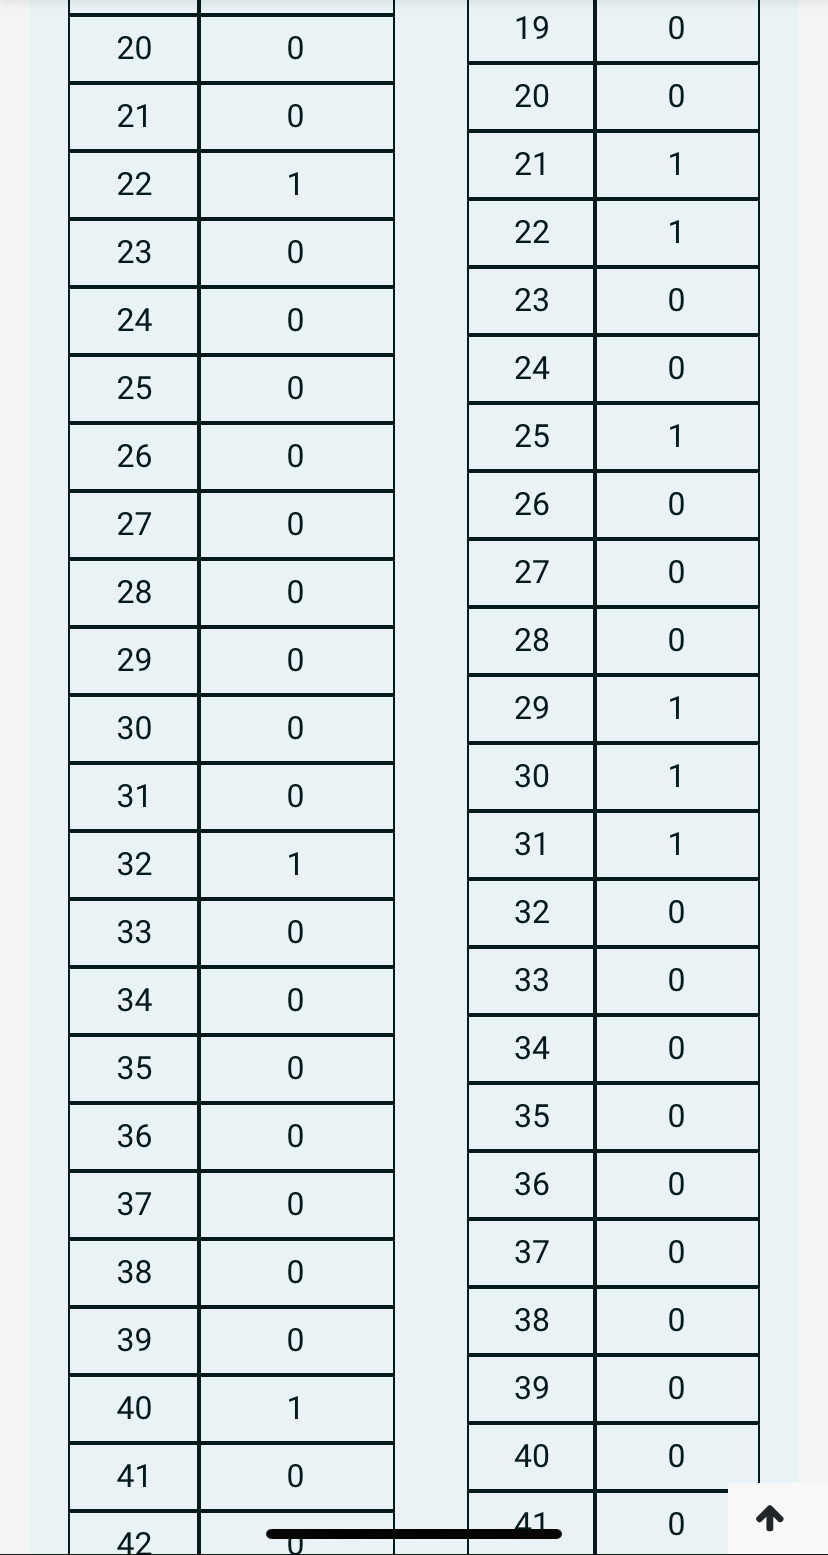
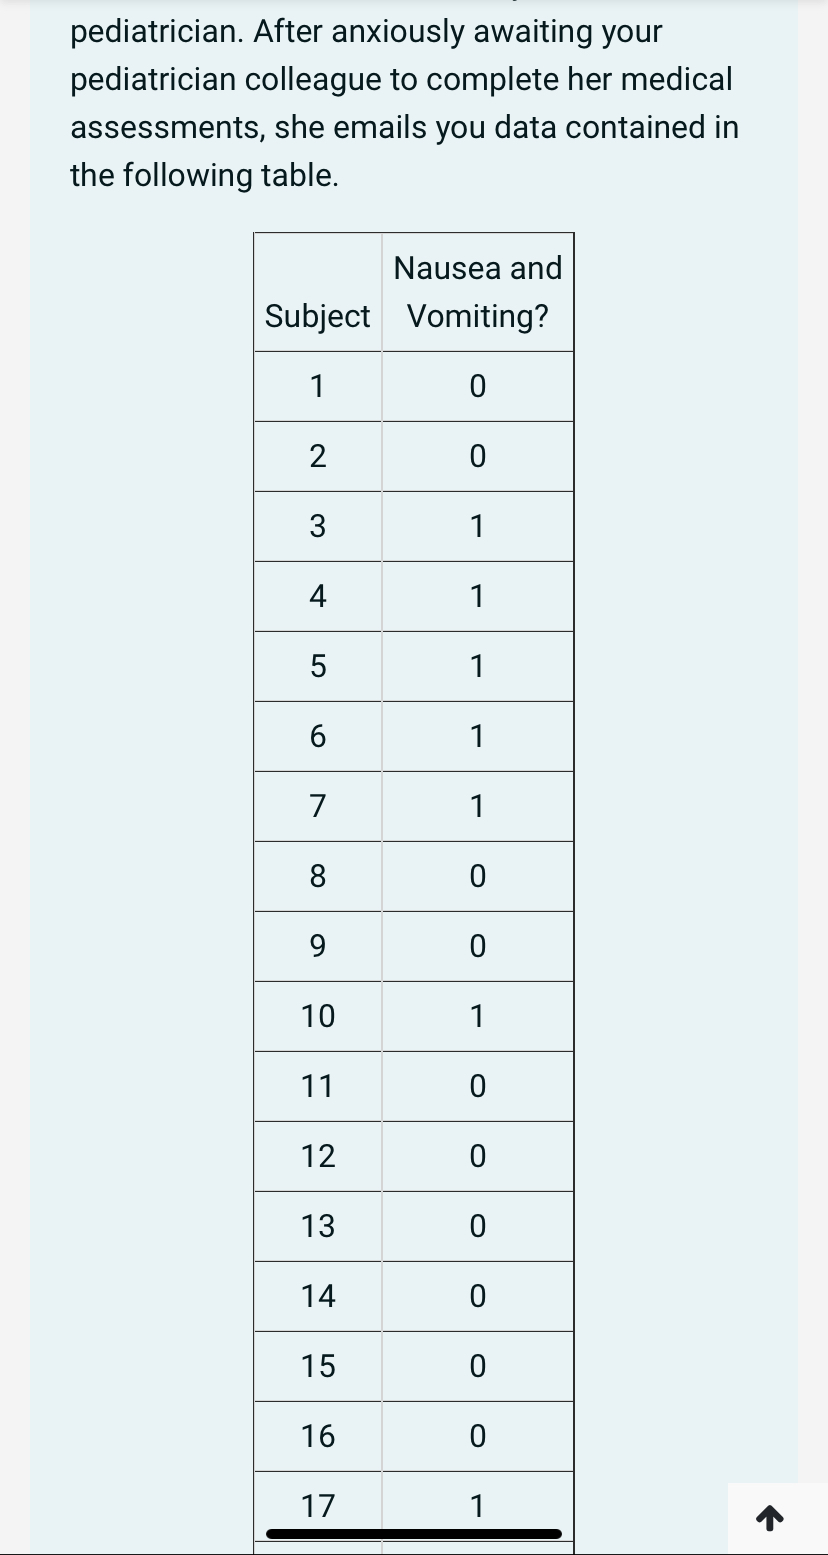
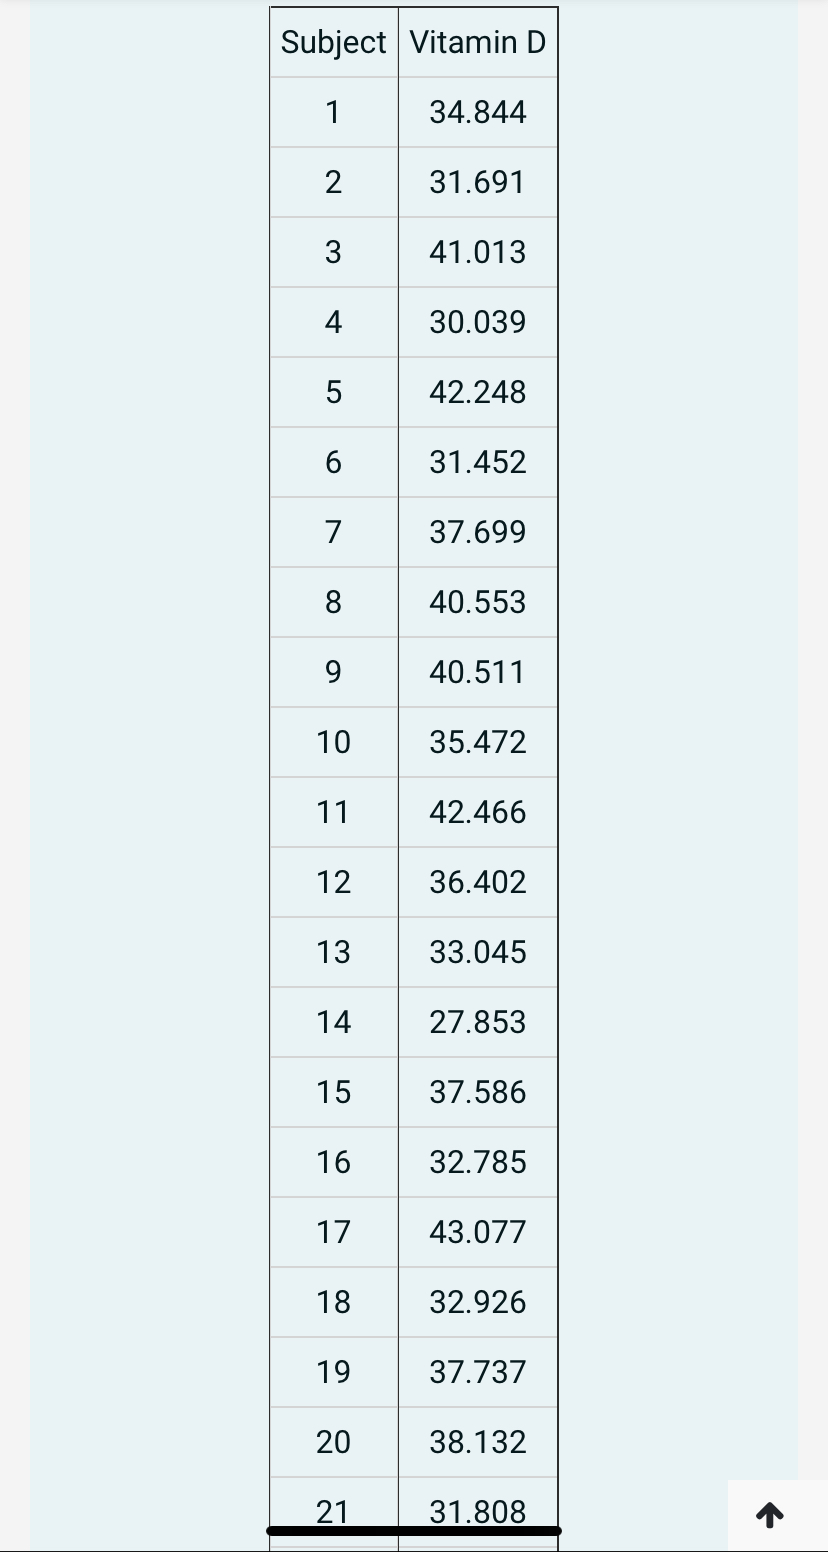
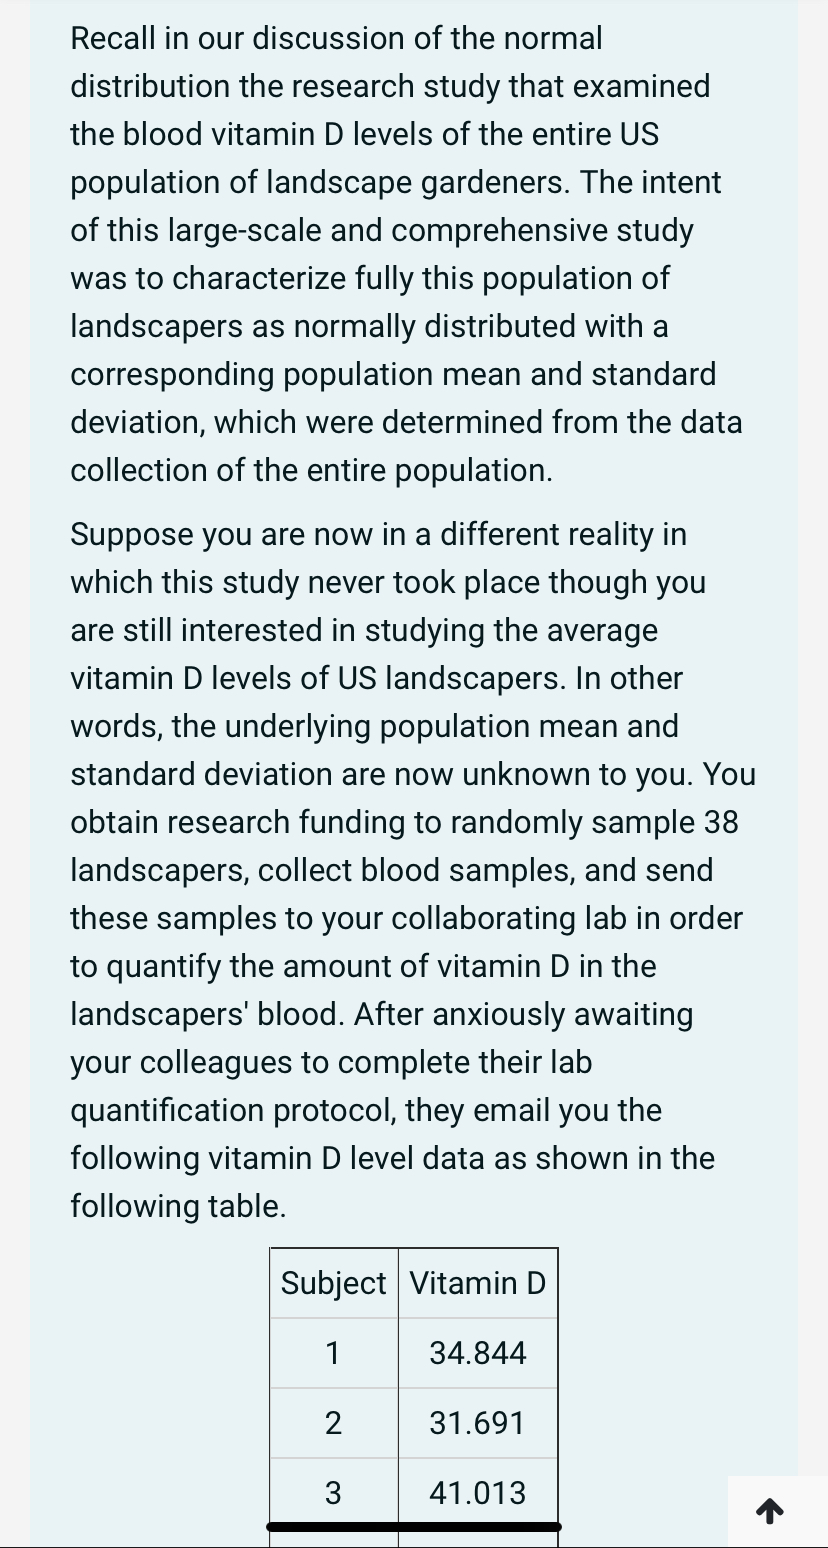
22 42.271 23 42.381 24 38.778 25 43.194 26 40.233 27 38.203 28 41.726 29 40.230 30 31.911 31 38.462 32 46.781 33 45.976 34 36.091 35 29.391 36 36.016 37 43.034 38 46.539 What is the estimated 95% confidence interval (CI) of the average blood vitamin D level of US landscapers in ng/ml? Please note the following: 1) you might calculate a Cl that is different from any of the multiple choice options listed below due to rounding differences, therefore select theshort sleeve shirts while outside working during a period of three weeks. After three weeks, you collect blood specimens and the landscapers are then to wear tank tops for the next three weeks under the same working conditions, after which you collect blood draws a second time. You obtain research funding to randomly sample 18 landscapers, collect blood samples at two different time points as described above, and send these samples to your collaborating lab in order to quantify the amount of vitamin D in the landscapers' blood. After anxiously awaiting your colleagues to complete their lab quantication protocol, they email you the following vitamin D level data as shown in the following table. Time Point 1, Shirts Time Point 2, Tank Vitamin D Tops Subject (ng/mL) Vitamin D (ng/mL) 1 44.264 41.080 2 58.890 38.460 3 41.806 35.518 4 61.748 46.937 5 59.525 45.075 6 44.206 35.969 7 47.706 36.606 34 30.1w I 35 29.391 36 36.016 37 43.034 38 46.539 What is the estimated 95% condence interval (CI) of the average blood vitamin D level of US landscapers in ng/mL? Please note the following: 1) you might calculate a Cl that is different from any of the multiple choice options listed below clue to rounding differences, therefore select the closest match; 2) ensure you use either the large or small sample Cl formula as appropriate; and 3) you may copy and paste the data into Excel to facilitate analysis. Select one: 0 a. 30.9 to 35.5 ng/mL O b. 36.3 to 39.5 ng/mL O c. 33.6 to 42.5 ng/mL 0 d. 31.6 to 35.1 ng/mL Recall in our discussion of the binomial distribution the research study that examined schoolchildren developing nausea and vomiting following holiday parties. The intent of this study was to calculate probabilities corresponding to a specied number of children becoming sick out of a given sample size. Recall also that the probability, i.e. the binomial parameter "p" dened as the probability of "success" for any individual, of a randomly selected schoolchild becoming sick was given. Suppose you are now in a different reality, in which this binomial probability parameter p is now unknown to you but you are still interested in carrying out the original study described above, though you must rst estimate p with a certain level of condence. Furthermore, you would also like to collect data from adults to examine the difference between the proportion with nausea and vomiting following holiday parties of schoolchildren and adults, which will reect any possible age differences in becoming sick. You obtain research funding to randomly sample 45 schoolchildren and 50 adults with an inclusion criterion that a given participant must have recently attended a holiday party, and conduct a medical evaluation by a certied pediatrician and general practitioner for the schoolchildren and adults, respectively. After anxiously awaiting your medical colleagues to complete their medical assessments, they em: 4. 36 0 37 0 37 0 38 0 38 39 0 0 39 0 40 1 40 0 41 0 41 0 42 0 42 0 43 0 43 0 44 0 44 1 45 0 45 0 46 0 47 48 0 49 0 50 0 What is the estimated 95% confidence interval (CI) of the difference in proportions between schoolchildren and adults developing nausea and vomiting following holiday parties? Assign groups 1 and 2 to be schoolchildren and adults, respectively. Please note the following: 1) in practice, you as the analyst decide how to assign groups 1 and 2 and subsequently interpret the results appropriately in the context of the data, thoughRecall in our discussion of the binomial distribution the research study that examined schoolchildren developing nausea and vomiting following holiday parties. The intent of this study was to calculate probabilities corresponding to a specified number of children becoming sick out of a given sample size. Recall also that the probability, i.e. the binomial parameter "p" defined as the probability of "success" for any individual, of a randomly selected schoolchild becoming sick was given. Suppose you are now in a different reality, in which this binomial probability parameter pis now unknown to you but you are still interested in carrying out the original study described above, though you must first estimate p with a certain level of confidence. You obtain research funding to randomly sample 42 schoolchildren with an inclusion criterion that he/she must have recently attended a holiday party, and conduct a medical evaluation by a certified pediatrician. After anxiously awaiting your pediatrician colleague to complete her medical assessments, she emails you data contained in the following table. Nausea andTime Point 1, Shirts Time Point 2, Tank Vitamin D Tops Subject (ng/ml) Vitamin D (ng/ml) 44.264 41.080 2 58.890 38.460 3 41.806 35.518 4 61.748 46.937 5 59.525 45.075 6 44.206 35.969 7 47.706 36.606 8 46.559 37.420 9 56.553 36.982 10 47.650 38.420 11 54. 188 38.598 12 56.868 34.974 13 58.405 32.456 14 38.534 40.299 15 54.865 34.549 16 59.110 33.342 17 48.367 29.252 18 60.013 39.737-n What is the estimated 95% condence interval (CI) of the difference in proportions between schoolchildren and adults developing nausea and vomiting following holiday parties? Assign groups 1 and 2 to be schoolchildren and adults, respectively. Please note the following: 1) in practice, you as the analyst decide how to assign groups 1 and 2 and subsequently interpret the results appropriately in the context of the data, though for the purposes of this exercise the groups are assigned for you; 2) 0 and 1 are dened as no and yes, respectively, which is a typical coding scheme in Public Health; 3) you might calculate a Cl that is different from any of the multiple choice options listed below due to rounding differences, therefore select the closest match; and 4) you may copy and paste the data into Excel to facilitate analysis. Select one: 0 a. -0.3012to 0.0035 0 b. -0.2817'lo 0.0038 0 C. 0.280210 0.0039 0 d. -0.334410 0.0040 36 0 37 38 0 39 40 41 0 42 0 What is the estimated 95% confidence interval (CI) of the proportion of schoolchildren developing nausea and vomiting following holiday parties? Please note the following: 1) 0 and 1 are defined as no and yes, respectively, which is a typical coding scheme in Public Health; 2) you might calculate a Cl that is different from any of the multiple choice options listed below due to rounding differences, therefore select the closest match; and 3) you may copy and paste the data into Excel to facilitate analysis. Select one: O a. 0.202 to 0.538 O b. 0.172 to 0.547 O c. 0.191 to 0.476 O d. 0.161 to 0.512Recall in our discussion of the normal distribution the research study that examined the blood vitamin D levels of the entire US population of landscape gardeners. The intent of this large-scale and comprehensive study was to characterize fully this population of landscapers as normally distributed with a corresponding population mean and standard deviation, which were determined from the data collection of the entire population. Suppose you are now in a different reality in which this study never took place though you are still interested in studying the average vitamin D levels of US landscapers. In other words, the underlying population mean and standard deviation are now unknown to you. Furthermore, you would like to examine if wearing tank tops instead of short sleeve shirts signicantly effects vitamin D levels. To accomplish this, you propose to collect data from the landscapers at two different points in time. Specifically, the landscapers are to wear short sleeve shirts while outside working during a period of three weeks. After three weeks, you collect blood specimens and the landscapers are then to wear tank tops for the next three weeks under the same working conditions, after which you collect blood draws a second time. You obtain research funding to randomly sample 18 landscapers, collect blood samples at two different time points as described above, and send these sanabDrating lab ir 4 \fWhat is the estimated 95% condence interval (CI) of the average difference in blood vitamin D levels between short sleeve shirt and tank top attire amongst US landscapers in ng/mL? Please note the following: 1) in practice, you as the analyst decide how to calculate the difference in vitamin D levels between time points for a given study participant, and subsequently interpret the aggregated results appropriately in the context of the data, though for the purposes of this exercise the difference is assigned for you as follows. Dene the difference as the second minus the rst time points, which is common practice, since the plus or minus sign of the resulting difference reects any change over sequential time; 2) you might calculate a Cl that is different from any of the multiple choice options listed below due to rounding differences, therefore select the closest match; 3) ensure you use either the large or small sample Cl formula as appropriate; and 4) you may copy and paste the data into Excel to facilitate analysis. Select one: 0 a. -18.51 to -10.77 ngme O b. -21 .48 to -11.% ng/mL O c. -15.74 to -9.16 ng/mL 0 d. -21 .38 to -9.64 ng/mL \fexamine the difference between the proportion with nausea and vomiting following holiday parties of schoolchildren and adults, which will reect any possible age differences in becoming sick. You obtain research funding to randomly sample 45 schoolchildren and 50 adults with an inclusion criterion that a given participant must have recently attended a holiday party, and conduct a medical evaluation by a certied pediatrician and general practitioner for the schoolchildren and adults, respectively. After anxiously awaiting your medical colleagues to complete their medical assessments, they email you data contained in the following tables. Table 1. Table 2. Schoolchildren Adults . Nausea and Subject _ , Vomiting? \fpediatrician. After anxiously awaiting your pediatrician colleague to complete her medical assessments, she emails you data contained in the following table. Nausea and Subject Vomiting? 1 0 2 0 3 1 4 1 5 1 6 1 7 1 8 0 9 U 10 1 11 0 12 0 13 0 14 0 15 U 16 U 17 1 \fRecall in our discussion of the normal distribution the research study that examined the blood vitamin D levels of the entire US population of landscape gardeners. The intent of this large-scale and comprehensive study was to characterize fully this population of landscapers as normally distributed with a corresponding population mean and standard deviation, which were determined from the data collection of the entire population. Suppose you are now in a different reality in which this study never took place though you are still interested in studying the average vitamin D levels of US landscapers. In other words, the underlying population mean and standard deviation are now unknown to you. You obtain research funding to randomly sample 38 landscapers, collect blood samples, and send these samples to your collaborating lab in order to quantify the amount of vitamin D in the landscapers' blood. After anxiously awaiting your colleagues to complete their lab quantication protocol, they email you the following vitamin D level data as shown in the following table. Subject Vitamin D 1 34.844 2 31.691 3 41.013