Answered step by step
Verified Expert Solution
Link Copied!

Question

1 Approved Answer

2.2 (d) tt=-1: 0.01 : 1; xx = cos ( 5*pi*tt ); zz - 1.4*exp (j pi/2) *exp (j*5*pi*tt); plot ( tt, xx, 'b-', tt,
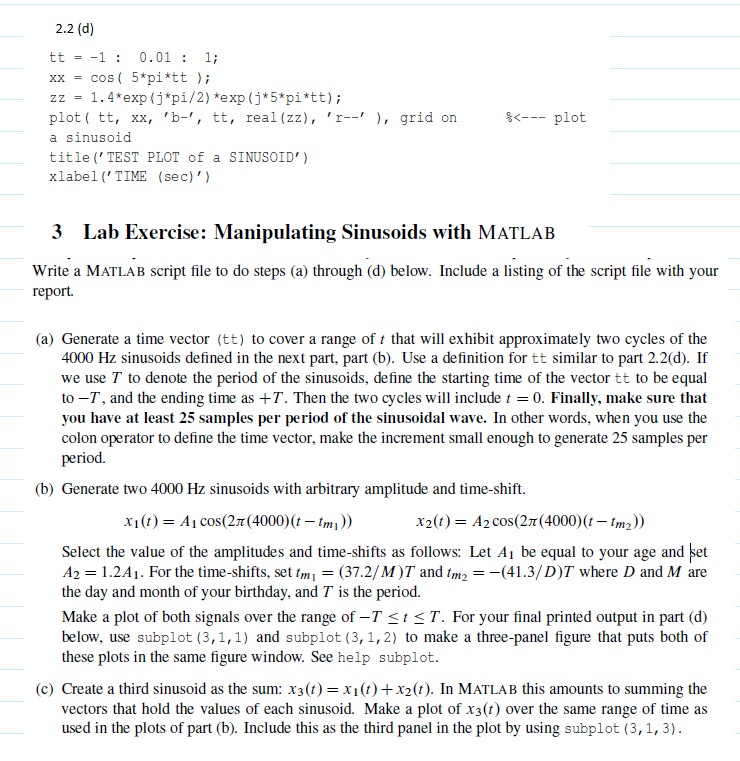
image text in transcribed

2.2 (d) tt=-1: 0.01 : 1; xx = cos ( 5*pi*tt ); zz - 1.4*exp (j pi/2) *exp (j*5*pi*tt); plot ( tt, xx, 'b-', tt, real (zz), 'r--, grid on a sinusoid title ('TEST PLOT of a SINUSOID' xlabel (' TIME (sec)) %( plot 3 Lab Exercise: Manipulating Sinusoids with MATLAB Write a MATLAB script file to do steps (a) through (d) below. Include a listing of the script file with your report. (a) Generate a time vector (tt) to cover a range of t that will exhibit approximately two cycles of the 4000 Hz sinusoids defined in the next part, part (b). Use a definition for tt similar to part 2.2(d). If we use T to denote the period of the sinusoids, define the starting time of the vector tt to be equal to-T, and the ending time as T. Then the two cycles will include t-0. Finally, make sure that you have at least 25 samples per period of the sinusoidal wave. In other words, when you use the colon operator to define the time vector, make the increment small enough to generate 25 samples per period. (b) Generate two 4000 Hz sinusoids with arbitrary amplitude and time-shift. xi(t) -Ai cos(2Tt(4000) x20t)-A2 cos(2Tt (4000) (t m2)) Select the value of the amplitudes and time-shifts as follows: Let A1 be equal to your age and bet A2 .2A1. For the time-shifts, set tm (37.2/M)T and m (41.3/D)T where D and M are the day and month of your birthday, and T is the period. Make a plot of both signals over the range of -Tt T. For your final printed output in part (d) below, use subplot (3,1,1) and subplot (3,1,2) to make a three-panel figure that puts both of these plots in the same figure window. See help subplot. (c) Create a third sinusoid as the sum: x3(t) -xi(t)+x2(t). In MATLAB this amounts to summing the vectors that hold the values of each sinusoid. Make a plot of x3(t) over the same range of time as used in the plots of part (b). Include this as the third panel in the plot by using subplot (3,1,3)

Step by Step Solution

There are 3 Steps involved in it

Step: 1

blur-text-image

Get Instant Access to Expert-Tailored Solutions

See step-by-step solutions with expert insights and AI powered tools for academic success

Step: 2

blur-text-image

Step: 3

blur-text-image

Ace Your Homework with AI

Get the answers you need in no time with our AI-driven, step-by-step assistance

Get Started

Recommended Textbook for

More Books

Students also viewed these Databases questions

Question

Are they spending less time with family and friends?

Answered: 1 week ago