

Answered step by step
Verified Expert Solution
Question
1 Approved Answer
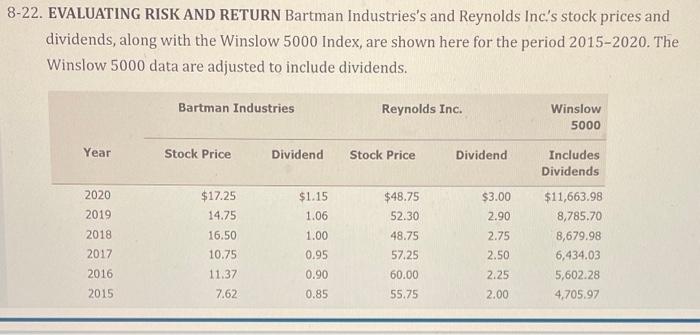
-22. EVALUATING RISK AND RETURN Bartman Industries's and Reynolds Inc.'s stock prices and dividends, along with the Winslow 5000 Index, are shown here for the
Step by Step Solution
There are 3 Steps involved in it
Step: 1

Get Instant Access to Expert-Tailored Solutions
See step-by-step solutions with expert insights and AI powered tools for academic success
Step: 2

Step: 3
Ace Your Homework with AI
Get the answers you need in no time with our AI-driven, step-by-step assistance
Get Started
Financial Markets And Institutions
Authors: Frederic S. Mishkin, Stanley Eakins
6th International Edition
0321552113, 9780321552112