

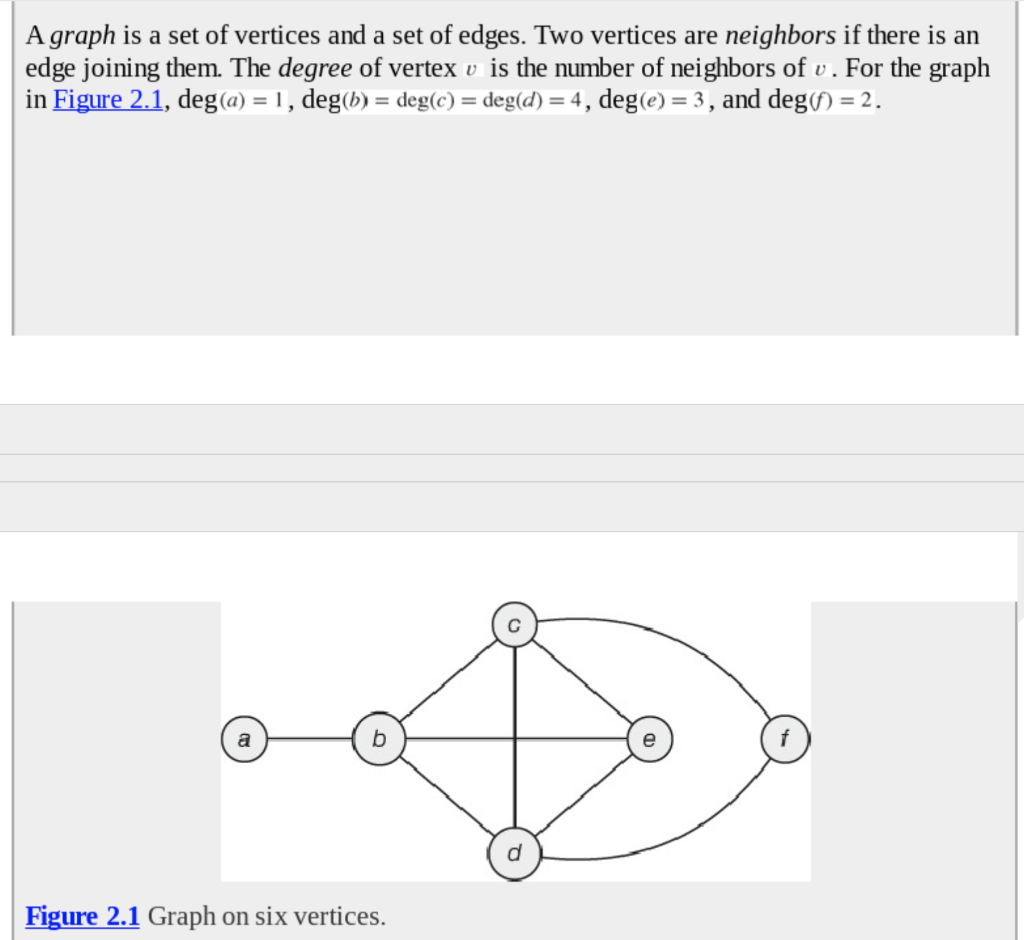
Question
2.24 R : Simulate 50 steps of the random walk on the graph in Figure 2.1. Repeat the simulation 10 times. How many of your
2.24 R : Simulate 50 steps of the random walk on the graph in Figure 2.1. Repeat the simulation 10 times. How many of your simulations end at vertex ? Compare with the exact long-term probability the walk visits .
here is figure 2.1
Step by Step Solution
There are 3 Steps involved in it
Step: 1

Get Instant Access to Expert-Tailored Solutions
See step-by-step solutions with expert insights and AI powered tools for academic success
Step: 2

Step: 3
Ace Your Homework with AI
Get the answers you need in no time with our AI-driven, step-by-step assistance
Get Started
Securing SQL Server Protecting Your Database From Attackers
Authors: Denny Cherry
2nd Edition
1597499471, 978-1597499477